
Read more...
8 September 2025
Common knowledge
I've written before about how we need Cross Silo Flow Metric Visibility in relation to patient flow data. Each silo (by which I mean each specialty, or each clinical directorate) has to be able to see not only their own flow metrics, but every other silo's flow metrics, too.
27 August 2025
Should've gone to Specsavers
I posted this image on X last week, fully expecting to be shot down in flames.
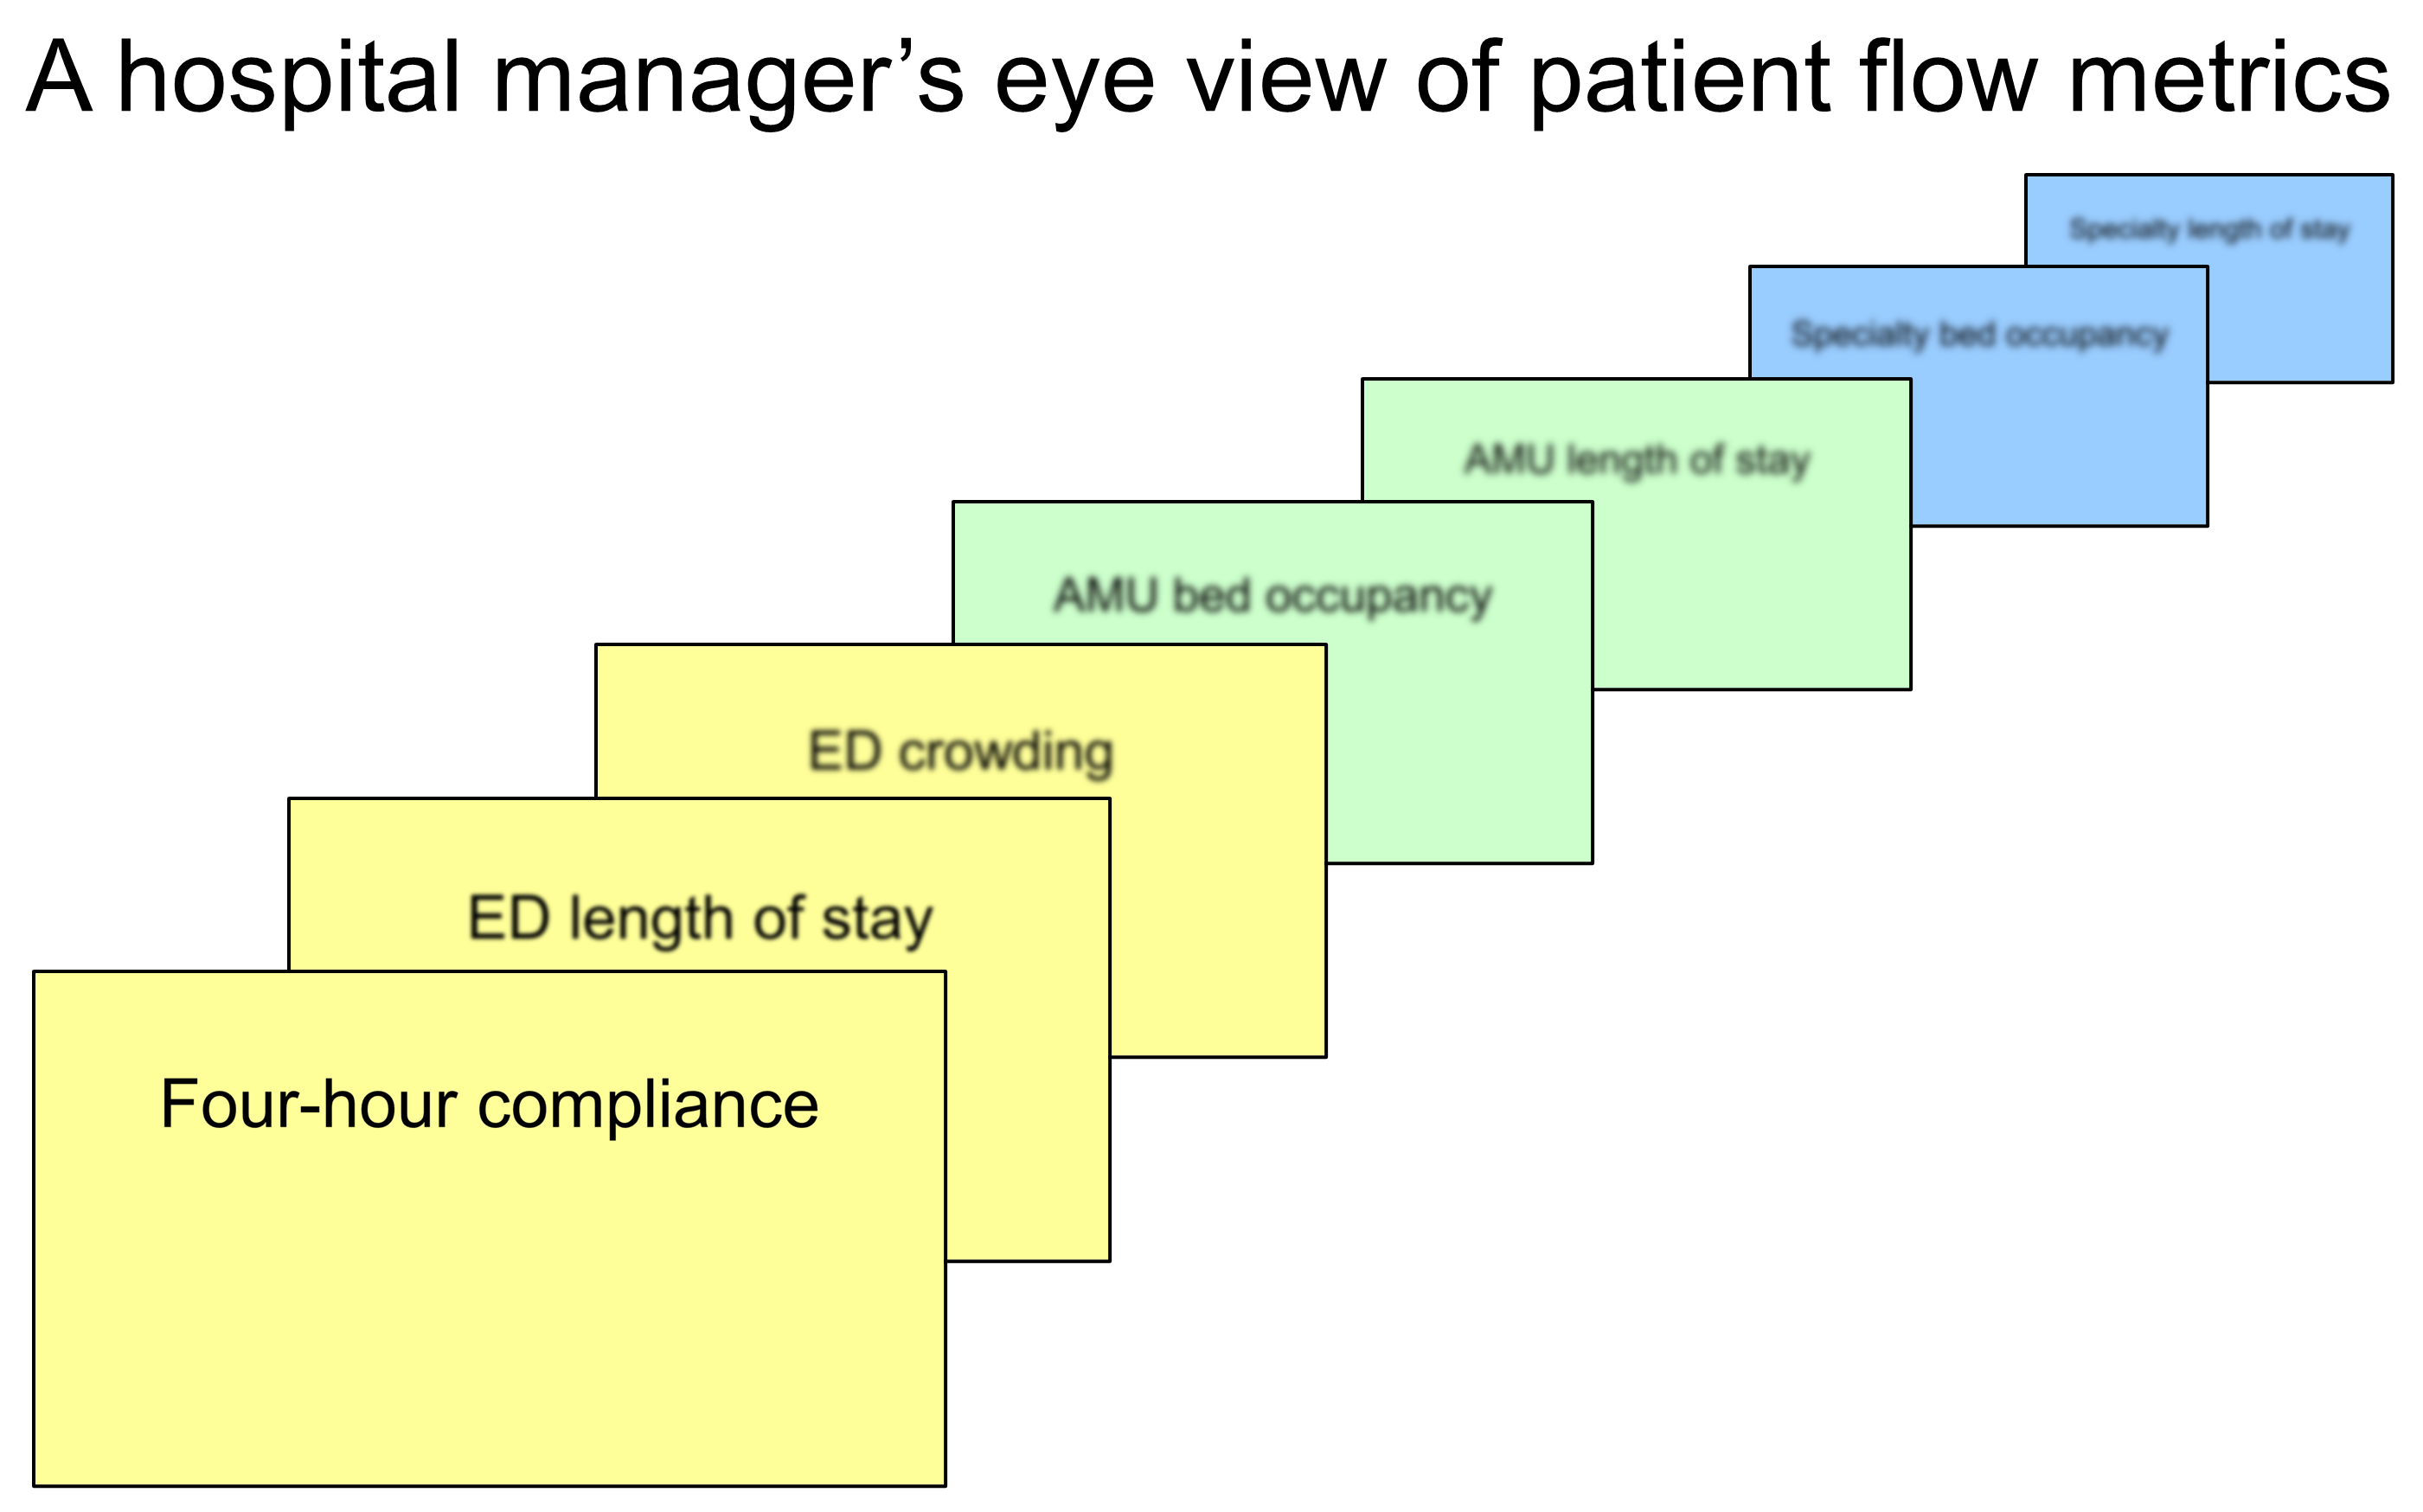
But nobody disagreed with the sentiment that when hospital managers use data to address the patient flow problem, the only indicator they get a proper, focused view of is a front door metric. They might be dimly aware that other—downstream—metrics also matter, but those metrics—if they exist at all—are too distant to see, too blurred to read.
Read more...
27 August 2025
Planes of conception
There's an Einstein quotation that I love: "No worthy problem is ever solved within the plane of its original conception." I love it because it explains why we struggle to solve the problem of patient flow.
Read more...
5 June 2025
Future heaviness
Harrogate. Sheffield. Hull. Bradford. Nine or ten years ago, Professor Mohammed Mohammed and I delivered a series of Flowopoly workshops for hospitals in Yorkshire and Humberside. We used tables, boards and cards to replay a 'bad' day and a 'good' day in the recent life of the hospital.
Read more...
3 June 2025
AMU heaviness
I want to see if the length of time patients spend in the emergency department (ED) is related to exit block. I'm interested in one aspect of exit block in particular: the fullness of the Acute Medical Unit (AMU).
Read more...
6 May 2025
The Outflow Theory
I'm keen to know if I'm just stating something that's obvious here, or whether I've stumbled across a correlation that might be useful in our efforts to understand patient flow. There is a very strong inverse relationship between the number of patients discharged from AMU each month and the number of >12-hour stays in the ED.
Read more...
2 May 2025
The Patient Flow Puzzle
What we're saying to each clinical director is: "You only need to know six numbers. Three 'what is' numbers. And three 'what ought to be' numbers.
But you really need to know them! To two decimal places!
Read more...
29 April 2025
Multi-sided dialogue
Most of us data analysts tend to see data presentations as a necessary evil. We'd avoid them completely if at all possible. But if avoidance isn't an option, then we think of them as things that need to be 'got through'. And we hope—we really hope—that nobody asks any questions at the end. We dread the questions even more than we dread the presentation itself.
Read more...
25 April 2025
Data Peer Review
If we approach meetings with peer review diagram as our mental model, we will think differently about meetings. Instead of fearing critique, we will instead be inviting critique.
Read more...
23 April 2025
Care about your message
It's not enough to be able to communicate your data message; you've also got to care about getting your data message across.
Read more...
21 February 2025
The AMU ALoSSF
If—like me—you're an adherent of the Exit Block Theory of A&E Performance, then you believe that the fullness of the destination—the admissions wards, in particular the Acute Medical Unit (AMU)—affects how long people spend in the Emergency Department (ED) before they get admitted. In a typical general hospital, roughly 30% of ED attendances end up being admitted, and—in general—the fuller the admissions wards, the longer the admissions-ward-bound patients in the ED have to wait before a bed becomes available.
Read more...
14 February 2025
The Tramlines Problem
...although control charts solve both the context problem and the signal/noise problem, they bring a new problem to the table. A problem that can be just as damaging as the original two problems. This new problem is the visual metaphor that gives control charts their resonance and appeal.
Read more...
11 February 2025
Analytics 2.0
We bang on about how we want 'data-driven decision-making' in healthcare, but the methods we use to communicate activity and performance data hinder decision-making because they treat decision-makers as passive consumers of data rather than as active co-designers of data. But if we want decision-making to be driven by data, we need to communicate data in a way that facilitates discussions that move things forward. Decision-makers need to be able to ask questions about the data, make suggestions about how the analysis can be refined, demand different visualizations. And this interactivity—this discussion element—won't be smooth and easy. It will involve debate, argument, and disagreement.
Read more...
31 January 2025
Inside the Red Box
This is a patient flow diagram produced by Monitor (NHS England's regulatory body) back in 2014. The boxes represent the various departments or staging posts that patients pass through during patient flow journeys, and the colour of the boxes is designed to represent the impact each box has on patient flow. The box with the most impact on patient flow—the red box—is the one labelled "OTHER HOSPITAL DEPARTMENTS", which mainly consists of the inpatient wards in the hospital.
Read more...
24 January 2025
Copilot's Manifesto
My version of Microsoft Word now prompts me to try Copilot every time I open a new document so today I finally thought what the heck and typed (of course I did): "I want to persuade healthcare managers that the way to improve patient flow is to provide hospital doctors with data on length of stay."
Read more...
11 November 2024
Triptych metrics
If I were a clinical director in an acute hospital, I would postively insist on seeing activity data like this updated every week. Three charts, side by side. The starter-for-ten platform for assessing how well—or how badly—patients are flowing through the directorate.
Read more...
8 November 2024
Kaplan-Meier curves
I like the idea of taking a data visualization from one discipline and applying it to another. Kaplan-Meier curves are often used for visualizing survival following the diagnosis of a serious illness, but I think they can also work for visualizing length of stay.
Read more...
25 October 2024
Overlapping histograms
I'm getting increasingly drawn to the idea of using overlapping histograms as a way of showing how something is - or is not - differnet from another thing. On eof the classic uses of overlapping histograms (in the stats textbooks, at least!) is a distribution of adult female heights on the left and a distribution of adult male heights on the right.
Read more...
11 October 2024
ED feedback loops
Is it the crowding that causes the length of stay? Or is it the length of stay that causes the crowding? When I ask clinicians this question, they usually say it's the crowding that causes long lengths of stay. But when I ask data analysts, they often say it's the long lengths of stay that cause the crowding.
Read more...
4 October 2024
In-frame length of stay
I'm trying to come up with a name for length of stay when I only want to describe the length of stay that occurs between two fixed points (in this case, 9th Sep and 16th Sep).
Read more...
27 September 2024
Process capability
Have a look at this chart and—for the moment—disregard the colour-coding and the arrows. It shows 366 days in the life of an inpatient specialty (it's General Medicine), and it's a specialty that has 55 beds officially allocated to it.
Read more...
20 September 2024
The Chernobyl courtroom scene
I've been re-watching the Sky drama series Chernobyl, and last night I got to the courtroom scene. The bit where Valery Legasov explains how the explosion happened, using red and blue acrylic tablets placed on a window-frame-type-thing was just virtuosic! Way better than PowerPoint!
Read more...
13 September 2024
The Eisenhower Matrix
Maybe it's a data analyst thing, but I can't help but think that the Eisenhower Matrix is the wrong way round. If I'm trying to use this for time management, and I score (on a scale from 1 to 10) each of the things on my to-do list with an 'urgency score' and an 'importance score', then something that's really urgent and really important will get 10 and 10. So that item should go in the top right of the matrix...
Read more...
6 September 2024
Translate everything
TRANSLATE EVERYTHING. That's the title of the very first chapter of Chip Heath and Karla Starr's book Making Numbers Count. When we write or talk about numbers we should use phrases like "What that means is..." or "To put that into context...", otherwise we're not doing it properly.
Read more...
4 September 2024
Funnel plots in Excel
I want to present the data in a 'non-confrontational' way. I want to say to the consultants: "Here is the extent of the variation. And here are the consultants whose mean length of stay is statistically significantly higher or lower than the overall average." But I don't want to do it in a 'finger-pointing blame-game' way.
Read more...
2 September 2024
We've done data.
In my opinion, you're not 'doing' data about patient flow unless you are plonking the data right under the noses of the people whose behaviour needs to change in order for the improvement to happen. In fact, not just 'plonking it under their noses', but talking them through the numbers, engaging in a dialogue with them, making appointments to speak to them again after you've re-analysed the numbers according to their observations and comments.
Read more...
26 August 2024
The RCEM's Roadmap to Recovery
Acute hospitals need to make available to each specialty its indicators. Its actual numbers, its 'ought-to-be' numbers. The specialties need to have routine meetings at which these numbers are presented and discussed.
Read more...
23 August 2024
Meetings, bloody meetings
Suddenly, just before six o' clock yesterday teatime, I had a 'light bulb' moment: I've been looking at it the wrong way all this time. Flow_ology isn't a series of graphs; it's a series of meetings.
Read more...
13 August 2024
Using Data to Make Business Decisions
This is a course I've been delivering for a few years now. It was originally commissioned by the London Skills Development Network. Anyway, I've recently re-designed it to make it much more practical and example-based. It's now a hands-on course with quite a bit of Excel and PowerPoint whereas before it was much more theoretical.
Read more...
9 August 2024
Arguing with Numbers
I've re-written the Arguing with Numbers webpage to better reflect how the course now looks. It's developed quite a lot in the last couple of years as I've experimented with new ways of presenting data and encountered new books and videos on how to do it.
Read more...
6 August 2024
"It's data, Jim. But not as we know it."
For a number of years during the Pre-Pandemic Era, I used to travel up and down the country facilitating a workshop called Flowopoly. Flowopoly was a very physical, very tactile, 'anti-digital' way of representing a hospital's patient flow using tables, boards and cards.
Read more...
3 August 2024
Flowopoly gets a makeover
Flowopoly has had a makeover. It still begins with a whole-hospital replay, but it now comes equipped with 'flow moments', 'zoomed-in' downstream specialty replays (which allow us to see a fortnight's patient moves in 45 minutes), and simulated what-if scenarios, so that we can see the impact of changes we make to the system.
Read more...
2 August 2024
Dances, masks and feathers
A couple of days ago I was introduced to a meeting as a 'field analyst'. Which—rightly or wrongly—I took as a compliment. And which prompted me to re-visit and edit a piece about data analyst 'fieldwork' I wrote seven years ago.
Read more...
31 July 2024
Data League Tables
I had a conversation yesterday with a consultant geriatrician. One of the things we talked about was the pros and cons of presenting length of stay data in league table format.
Read more...
18 July 2024
The green zone
We can usually measure how long patients spend waiting in A&E for a bed to become available. The idea here is that we're just measuring the amount of delay. It's how long the patient is spending in A&E once the A&E bit of their treatment has been completed. This information can be useful if we want to get a clearer picture of the extent to which exit block is a problem for patient flow.
Read more...