Data analysts often need to write reports that summarize their findings. And they often have to present their findings to meetings. Arguing with Numbers is a one-day course that teaches the skills needed to write and talk about data effectively. We address short-form narratives in the first half of the course and long-form narratives in the second.
Session 1
09:30 to 11:00
Topping and tailing single data exhibits
The first session of the course teaches the elements of how to introduce and describe a datagraphic in a one-side-of-A4 written document or in a short spoken presentation. We go through several teaching examples and exercises to practice and 'cement' these elements.
Session 2
11:15 to 12:45
Make your text flow
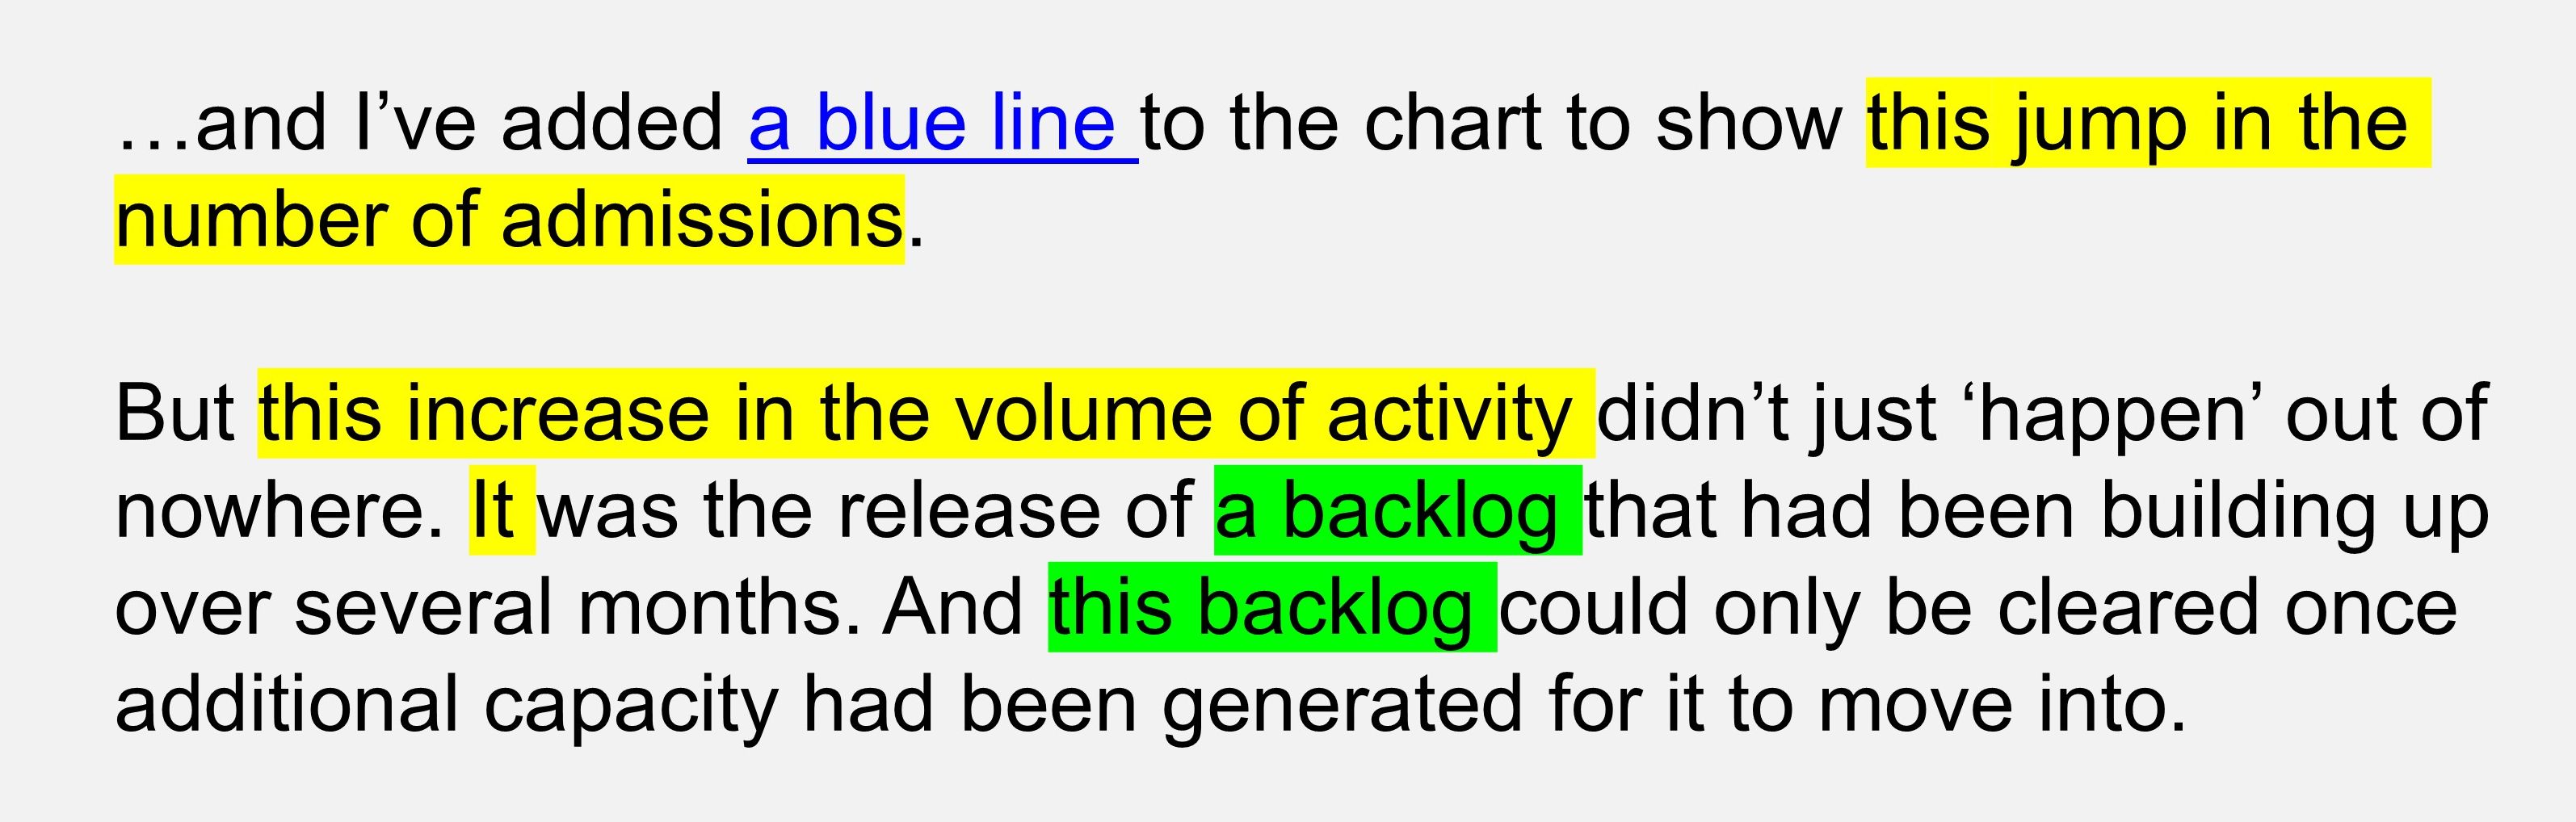
In the second session we cover the techniques needed to make your text flow. From Glasgow Caledonian University's 'hook-and-eye' approach to David Hume's Enlightenment philosophy, we get participants to see how sentences, paragraphs and datagraphics should connect together. And we steal from Ros Atkins the idea of drafting a 'guide script' in a conversational tone of voice to audit our presentation for 'point-to-point connectivity'.
Session 3
13:30 to 15:00
Shape and structure for longer documents and presentations
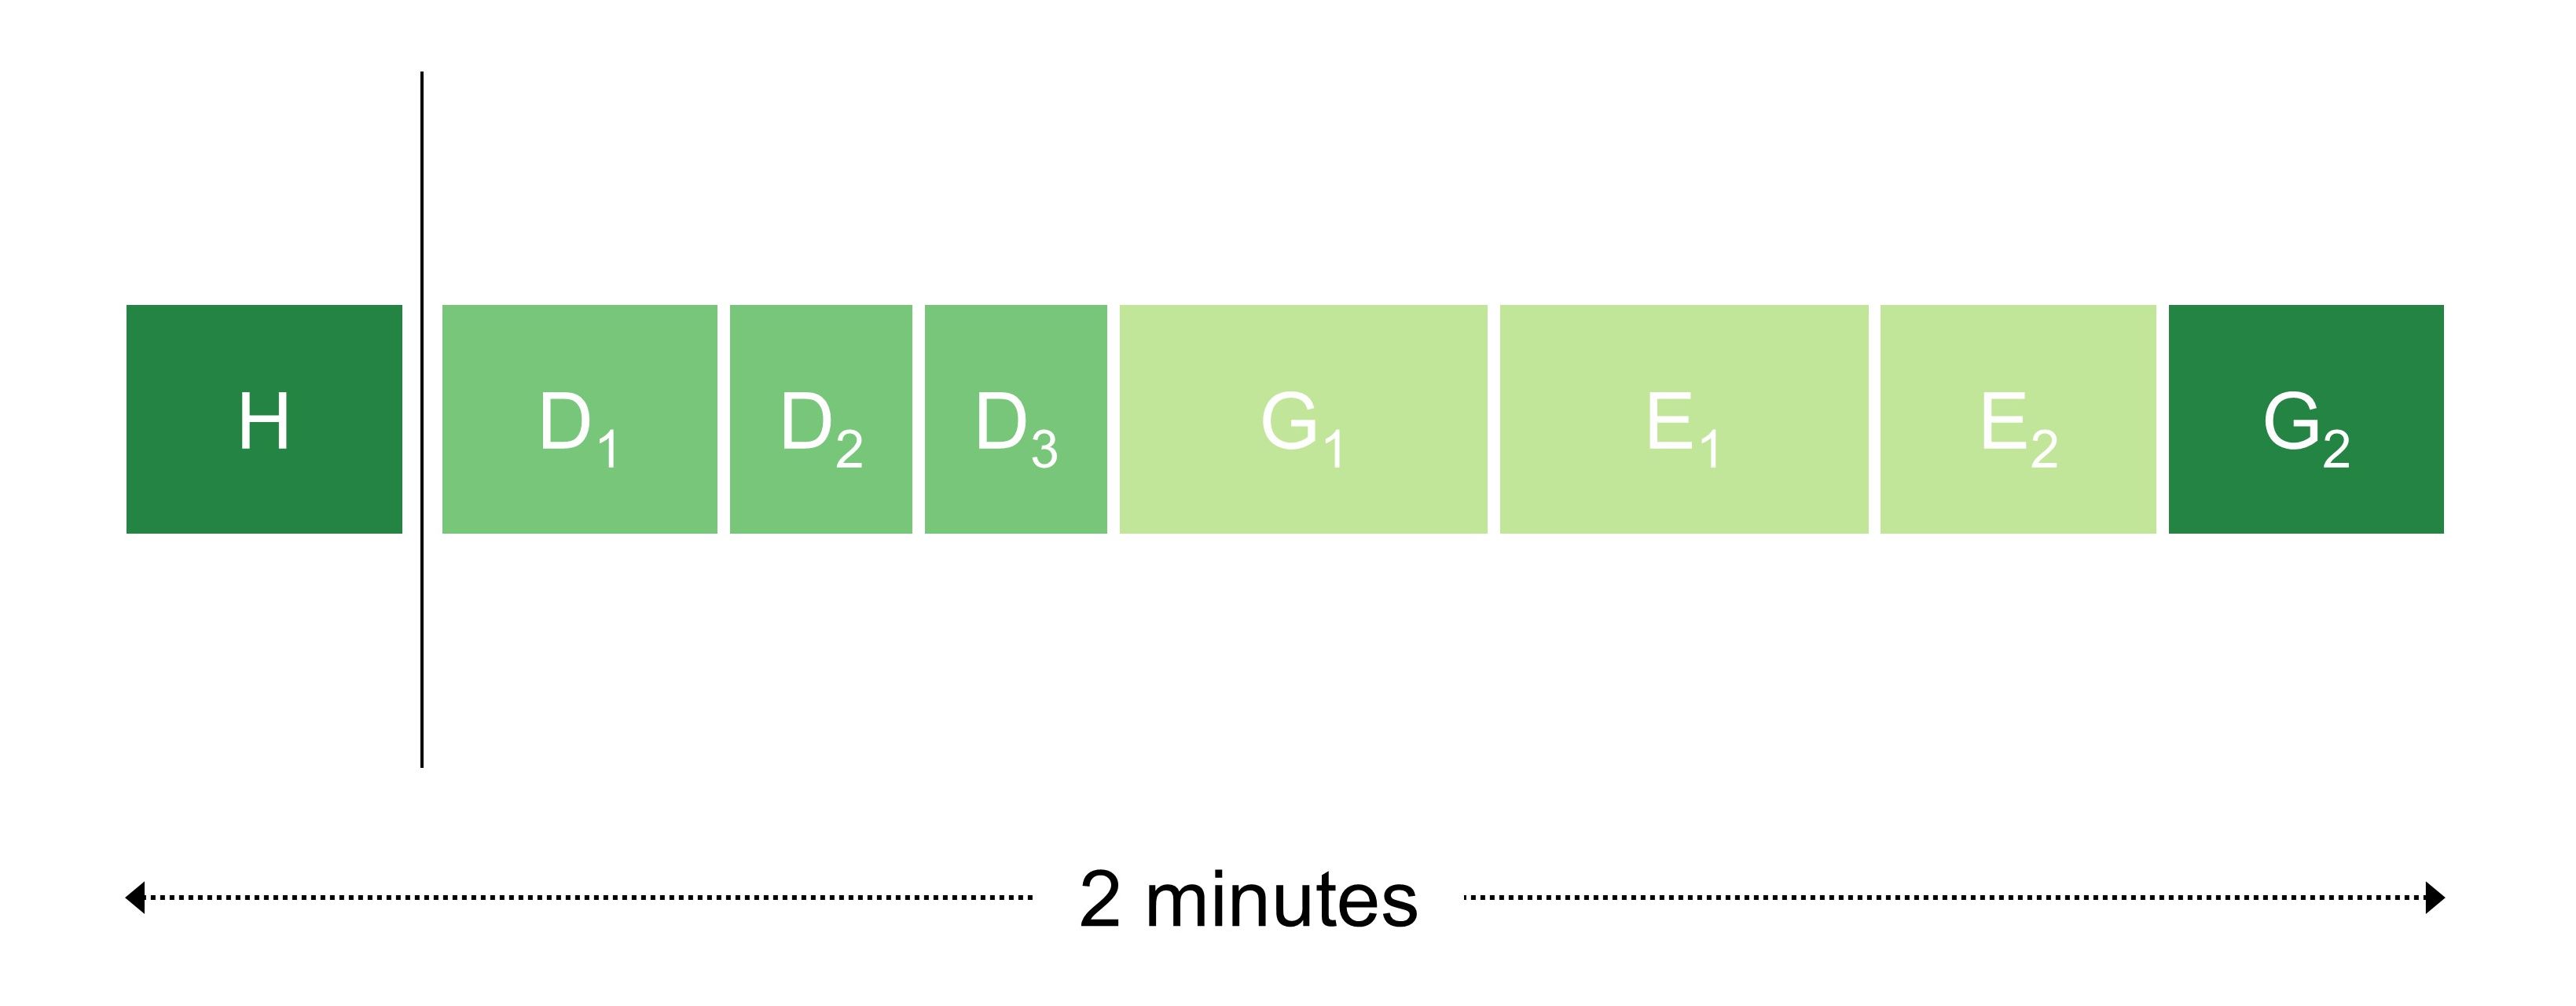
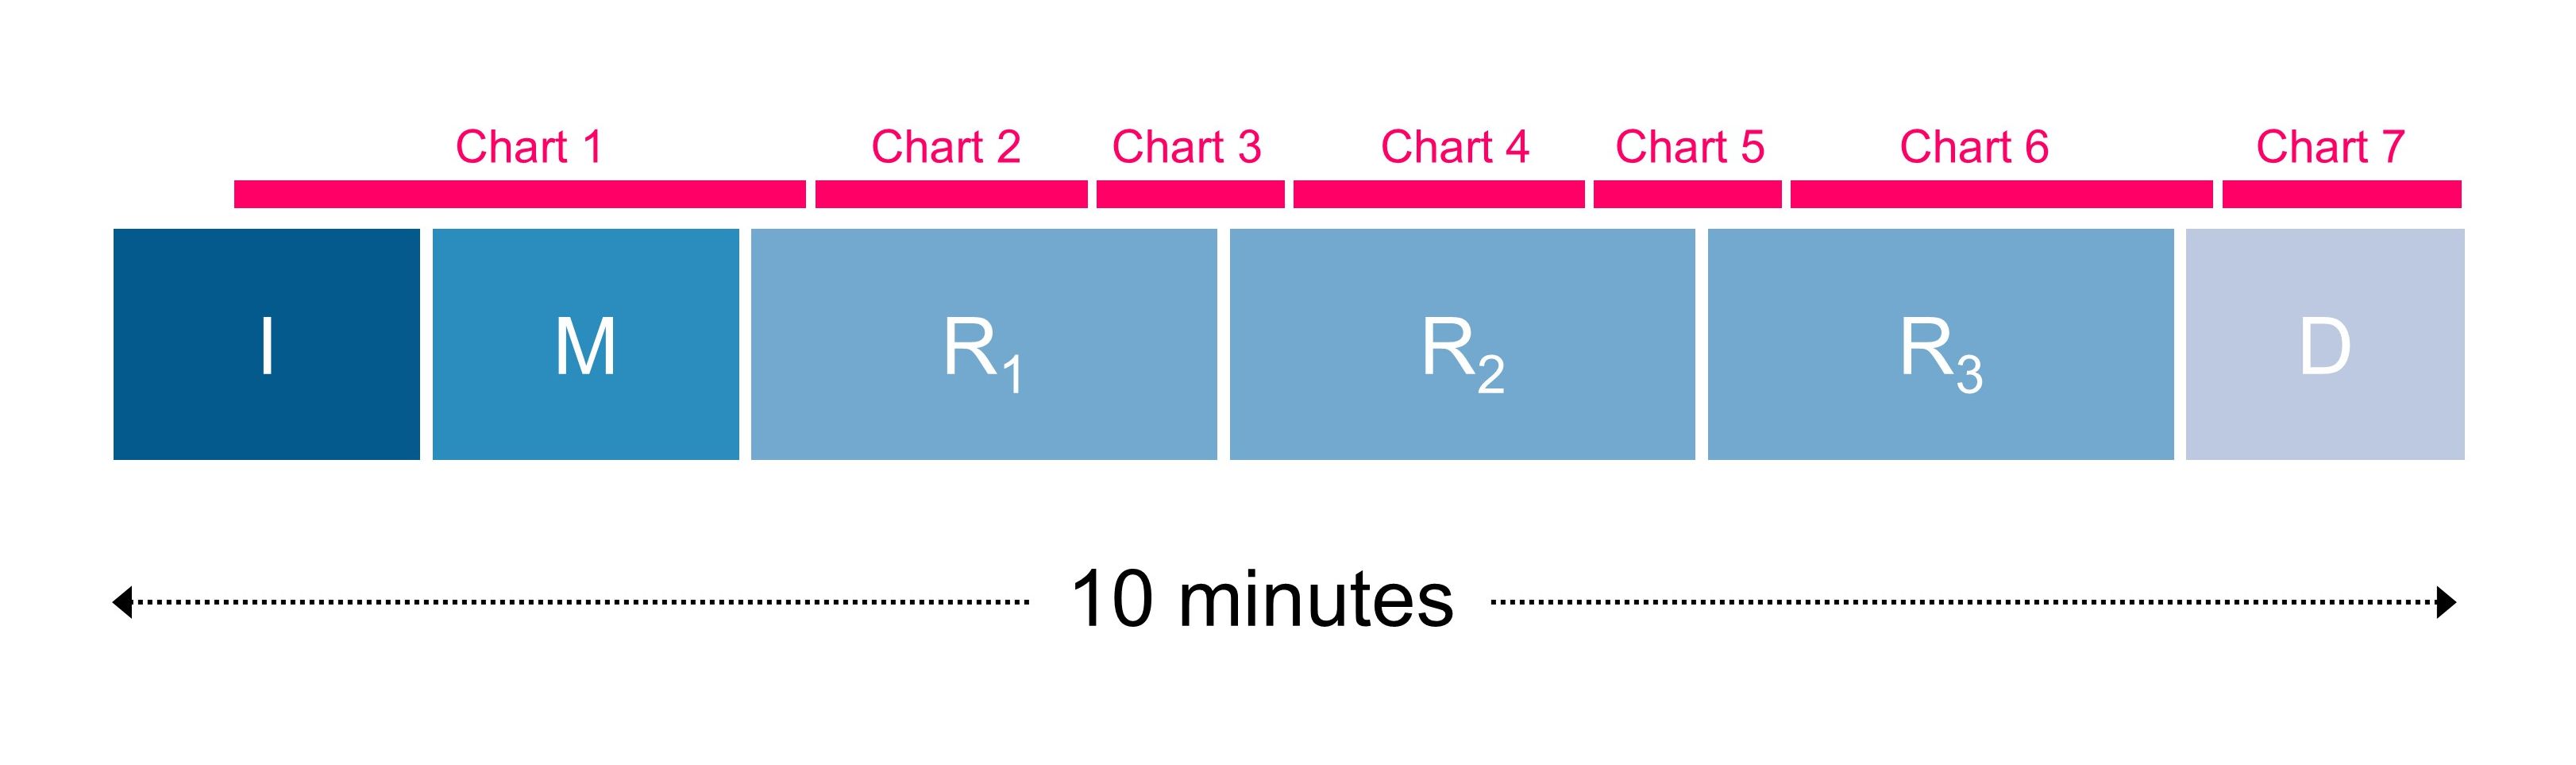
When your data-rich report is a longer one (several pages), or when your data presentation is going to run to longer than just two minutes, you need to apply different techniques for shaping and structuring your content. In this session we show how to build a data argument from scratch, showing what needs to be included in each section, and how exactly to insert data exhibits into the appropriate points in the argument.
Session 4
15:15 to 16:30
Connecting the sections of an argument
In the final session of the course we work on how best to join up the various sections of our report. How do we decide which of our three points to make first? How do we segue from the first point to the second point without making the audience think we've missed a beat?
Arguing with Numbers can be booked as either an on-site face-to-face course or as a virtual course (via Microsoft Teams) for £1,250+VAT, and up to 12 participants can be accommodated in each workshop session. Email info@kurtosis.co.uk to start making arrangements.
A degree of familiarity with Microsoft Excel, Microsoft Word and Microsoft PowerPoint is needed for this training course.