We can usually measure how long patients spend waiting in A&E for a bed to become available. How much time do patients spend in A&E once the A&E bit of their treatment has been completed. This information can be useful if we want to get a clearer picture of the extent to which exit block is a problem for patient flow.
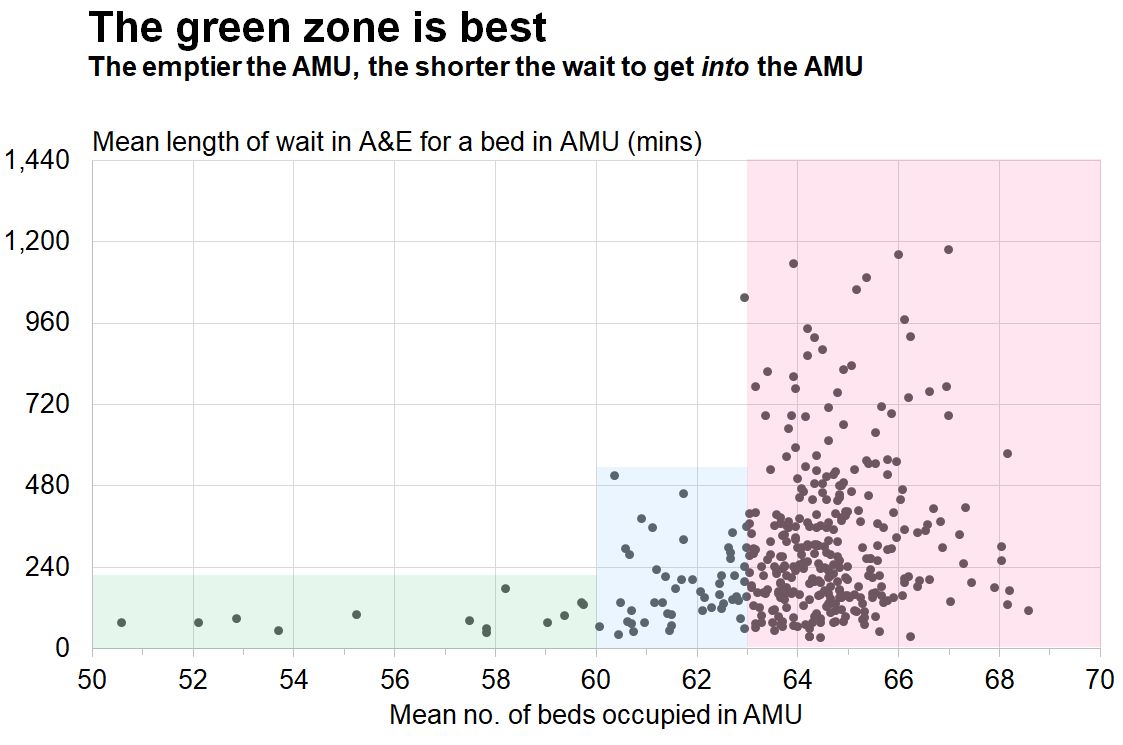
The most common ward destination for A&E patients is the Acute Medical Unit (AMU). So the chart below compares the number of beds occupied in the AMU (along the horizontal axis) with the length of time AMU-boun0.25patients spend waiting in A&E for a bed to become available:
I've split the 365 days into three zones and I've shaded each zone a different colour.
Starting on the left, with the green zone, there were just 13 days when the average number of beds occupied in AMU was below 60. So the green zone is sparsely populated. But on none of these 13 days did the average time spent in delay exceed 176 minutes.
There were 51 days in the blue zone. These were the days when the AMU was between 60 and 63 beds full. In percentage terms, that's between 88% and 93% bed occupancy. On none of these 51 days did the average time spent in delay exceed 511 minutes.
Finally, the pink zone covers those days when the AMU was more than 63 beds full. There were 301 days when this was the case. The average wait for a bed on a blue zone day was 321 minutes and on some days the average wait was nearly 1,200 minutes.
So, yes, the green zone is where we get the best outcomes. The hospital needs to do whatever it needs to do to enable the AMU to get its average bed occupancy down from 94% (the average for calendar year 2023) to something lower than 88%. Only then will the exit block for medical admissions in A&E be eased.
[18 July 2024]