I want to see if the length of time patients spend in the emergency department (ED) is related to exit block. I'm interested in one aspect of exit block in particular: the fullness of the Acute Medical Unit (AMU).
Roughly 30% of ED attendances end up being admitted. And roughly half of these get admitted to the Acute Medical Unit (AMU). So yes, the AMU is only one of several possible exits. But it's the most commonly-used exit from the ED for admitted patients. And it's also—usually—the exit that's the most blocked.
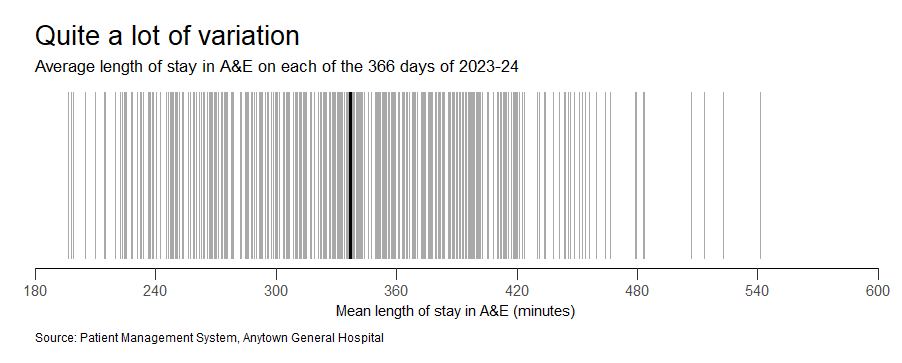
I took a year's data from a large general hospital. 2023-24. I looked at the ED average length of stay values for each of the 366 days in that financial year. On the day with the shortest average length of stay, it was 196 minutes; on the day with the longest, it was 541 minutes. So there was quite a lot of day-to-day variation.
Next, I looked at the fullness (measured by counting the average number of occupied beds) of the AMU for those same 366 days. (Actually, I had to make do with 359 days because the data for the last seven days of March 2024 was missing!)
The AMU had 68 beds altogether. And the 359 average daily AMU fullness values varied from 49.6 to 67.6. The median level of fullness was 63.6. That equates to an average percentage bed occupancy value of 93.5%.
(There's a debate about whether to include AMU-bound patients currently queuing in the ED as part of AMU fullness. I think these patients should be included in the AMU fullness figures, but—sadly—I didn't have these figures available to me, so they're not included in what follows.)
I divided the 359 AMU fullness values into two chunks and colour-coded them. Blue for the days when AMU fullness was below the median value of 63.6. Red for the days when AMU fullness was above the median value of 63.6. Then I re-visualized my ED length of stay barcode as two ED length of stay barcodes.
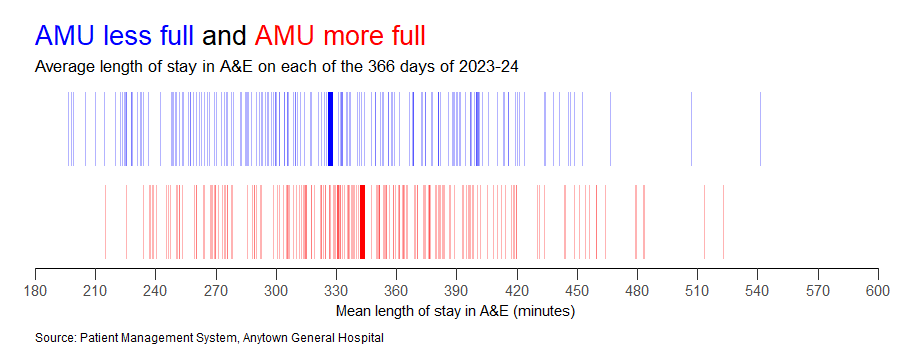
I've drawn thicker vertical lines to show the mean ED length of stay for each chunk. It's 327 minutes for the blue (less full) days, and it's 343 minutes for the red (more full) days. So yes, there's a difference. But really not much of a difference. Only 16 minutes of a difference.
I'll be honest: I was expecting a bigger difference. But then it occurred to me that this was a year when the AMU was—to all intents and purposes—always full. So maybe it wouldn't make much of a difference to ED length of stay whether the AMU was 95%, 96% or 97% full.
And I also remembered something I'd been told about the 'viscosity' of patient flow. I've heard clinicians and bed managers distinguish between 'active' beds and 'inactive' beds. Some inpatients are more likely than others to be transferred or discharged imminently.
So I had a go at trying to quantify this 'viscosity' for the AMU. For each hourly snapshot of AMU fullness, I calculated the length of stay so far of the patients captured in each snapshot.
I wanted to be able to distinguish between, on the one hand, an AMU with 65 patients in it whose average length of stay so far was 19 hours. And, on the other, an AMU also with 65 patients in it but whose average length of stays so far was 56 hours.
Because I'm measuring the weight of accumulated bed days, I called these my 'AMU heaviness scores'. As I had done earlier with the fullness values, I split these 359 heaviness scores into two chunks, colour-coded according to whether they were 'lighter' or 'heavier' than the median 'weight' (a mean length of stay so far of 31.6 hours).
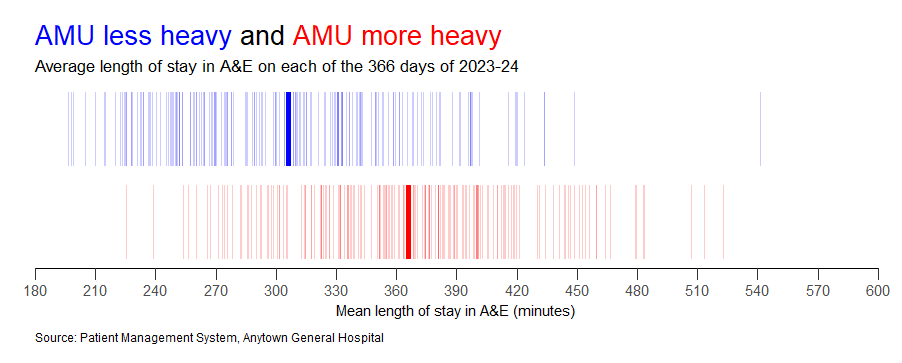
And when we do this we can see much more of a difference. Patients spent 366 minutes in the ED on the 'heavier' days, compared with 306 minutes in the ED on the 'lighter' days.
This method feels both crazily convoluted and utterly logical at the same time. I'm conscious that I might've gone down a rabbit hole, found an interesting new metric and got inappropriately excited about it without testing it against reality. So: all comments welcome!
Flow_ology can be booked as an on-site face-to-face course for £1,250+VAT, and up to 12 participants can be accommodated in each workshop session. Email info@kurtosis.co.uk to start making arrangements. Open course places cost £350+VAT.