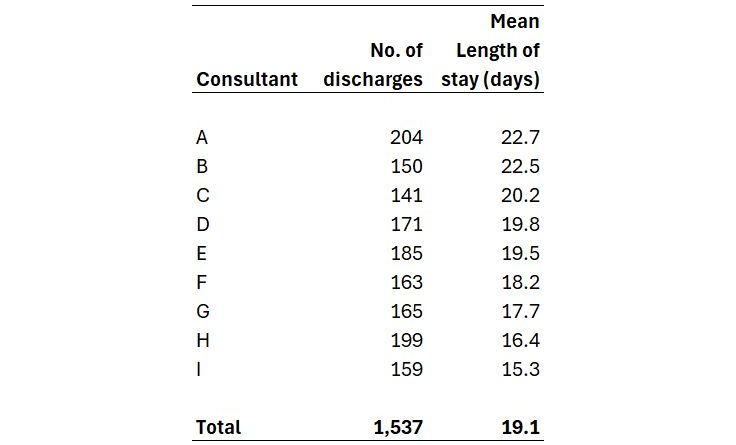
I had a conversation yesterday with a consultant geriatrician. One of the things we talked about was the pros and cons of presenting length of stay data in league table format. This table shows - for calendar year 2023 - the number of discharges and the mean length of stay for each of nine consultant geriatricians in a large general hospital. The consultants have been ranked from longest length of stay at the top to shortest length of stay at the bottom.

We want the specialty as a whole to reduce its mean length of stay from 19.1 days to 18.0 days. We can see from the consultant league table that last year there were three consultants (G, H and I) who were already achieving this. (I've changed the numbers in the table, by the way, to ensure complete anonymity here.) My question was: "Can we use data presented like this to develop the conversation about reducing length of stay?"
My consultant colleague felt that it depended on the pre-existing culture. Some directorates would be happy to embrace league tables like this, even ones that weren't anonymized; others would be outraged. My own view - motivated at least in part by self-preservation - is that (a) I'd only want to present a league table like this if I could at least also show the margins of error and (b) I'd want the clinical director to ask me to present it, rather than it being my decision alone.
Incidentally, my 'margins of error' argument owes a lot to a comment in the abstract of one of David Spiegelhalter's articles from 20 years ago, when he was busy advocating the use of funnel plots in the NHS: "We conclude that funnel plots are flexible, attractively simple, and avoid spurious ranking of institutions into 'league tables'." (Stat Med. 2005 Apr 30;24(8):1185-202.)
League table data presentations are also an instance of what Jer Thorpe (in his 2021 book Living in Data) describes as what happens when the word 'data' is used as a verb.: "Data is not inert, yet its perceived passivity is one of its most dangerous properties. When we are warned that a government is collecting data about its citizens, we may be underwhelmed specifically because this act of collection seems to be so harmless, so indifferent. But of course data is not collected and then left alone. It is used as a substrate for decision-making and as an instrument for differentiation, discrimination, and damage."
So when a consultant sees themselves ranked in a league table, they are entitled to feel as if they've been data-ed. Hence why outrage can sometimes ensue.
[31 July 2024]