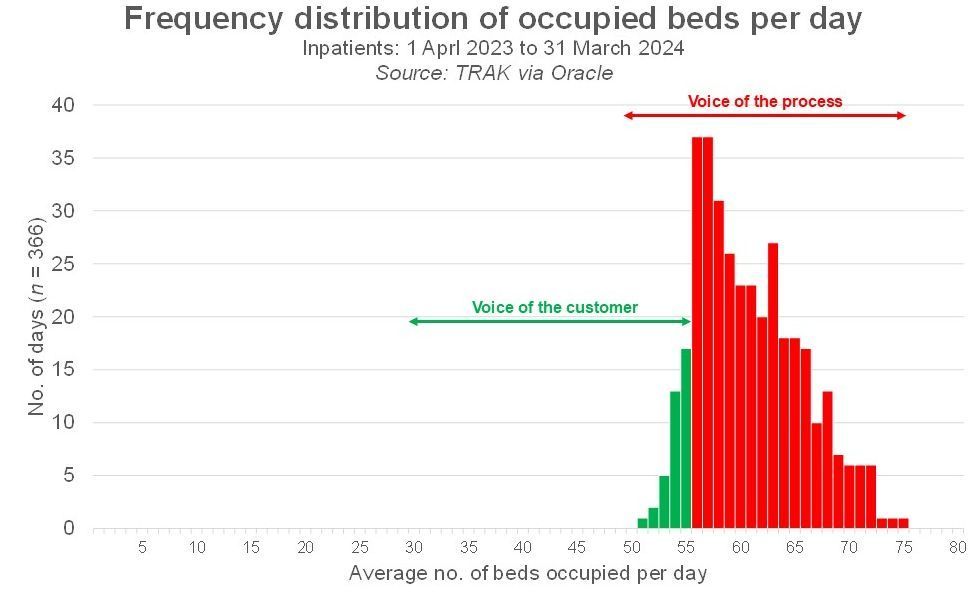
Have a look at this chart and—for the moment—disregard the colour-coding and the arrows. It shows 366 days in the life of an inpatient specialty (it's General Medicine), and it's a specialty that has 55 beds officially allocated to it. The emptiest day of 2023-24 was a day when only 51 of those beds were occupied; the fullest day was a day when 75 beds were being occupied. The average number of beds occupied by General Medicine inpatients last year was 62.

I've used colour to distinguish between the 38 days on the left (when the specialty was 'living within its means') from the 328 days on the right (when it wasn't). I am trying to work out how to draw a control chart of daily bed occupancy where the control limits are based not on what actually happened in the 366 days of 2023-24 but on what ought to have happened in 2023-24.
Normally, if I were to present a control chart to this specialty, I'd be saying something like: "Here's what your day-to-day bed occupancy was last year. Your upper control limit was up at around 74 and your lower control limit was down at about 50. Your average of 62 was in the middle of that range." But I don't want to do that. I want my control limits to show not the limits of the process that actually happened but—instead—the limits of the process that ought to happen. So the upper comtrol limit should not exceed 55 (the specialty's bed allcoation). In a perfect world, the specialty would never have to borrow beds from other specialties.
But how do I calculate where the lower control limit should go? Do I just assume that—if General Medicine were somehow to miraculously start living 'within its means'—its day-to-day bed occupancy variability would be just as variable as it is now? In which case, that range of 24 (between 74 and 50) would be replicated but I'd start from an upper limit of 55 instead of 74? Or can I look at the actual number of days when this specialty actually lived 'within its means' (the green days on the chart) and use that much smaller degree of variability to draw my lower limit?
[27 September 2024]