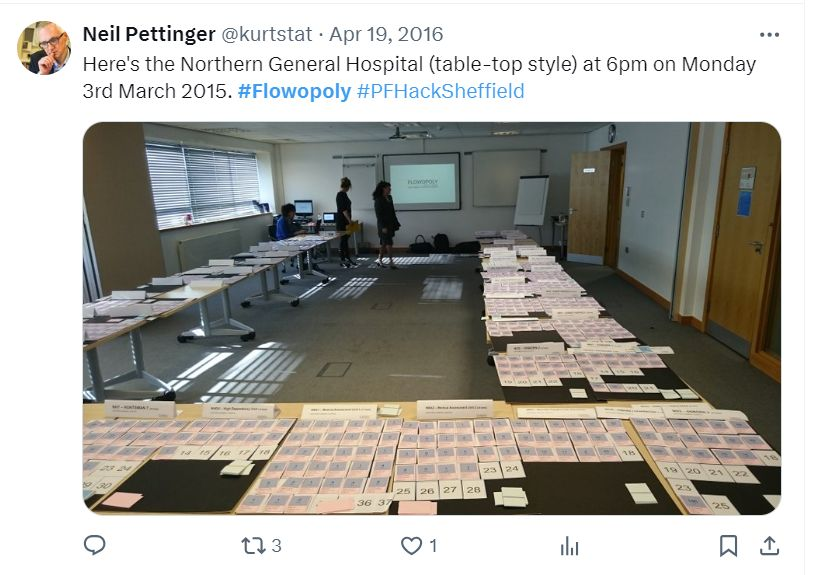
Harrogate. Sheffield. Hull. Bradford. Nine or ten years ago, Professor Mohammed Mohammed and I delivered a series of Flowopoly workshops for hospitals in Yorkshire and Humberside. We used tables, boards and cards to replay a 'bad' day and a 'good' day in the recent life of the hospital.
Back in 2016 there was a logic to this approach. A 'bad' day would've been a day when the hospital achieved c.75% compliance with the four-hour target. A 'good' day would've been a day when the hospital achieved c.95% compliance.
There was a method to the way we selected the 'good' and 'bad' days. We didn't want to choose an 'outstandingly good' or a 'catastrophically bad' day. We thought the best learning would come from choosing a 'typically good' and a 'typically bad' day.
And in 2015 a typically good day would've been a 95% day. So the characteristics of the good day could be held up as a sort of model for what all days ought to be like.
One of the things that Flowopoly made visible was that the hospital was quite a lot less full on the 'good' day than it was on the 'bad' day. 95% compliance with the four-hour target was achieved because there were always empty beds for patients to be admitted and transferred into.
Fast forward to 2025 and 95% compliance days are virtually non-existent. In a Flowopoly workshop now, we'd be lucky if a 'good day' achieved 75% compliance. So while it would be better than its 'bad day' counterpart (probably 50% compliance), we couldn't really hold the good day up as a model to be emulated. It would be too sub-optimal.
So when I try to show the 'bed fullness effect' on ED length of stay, we can see the effect, but there are caveats:
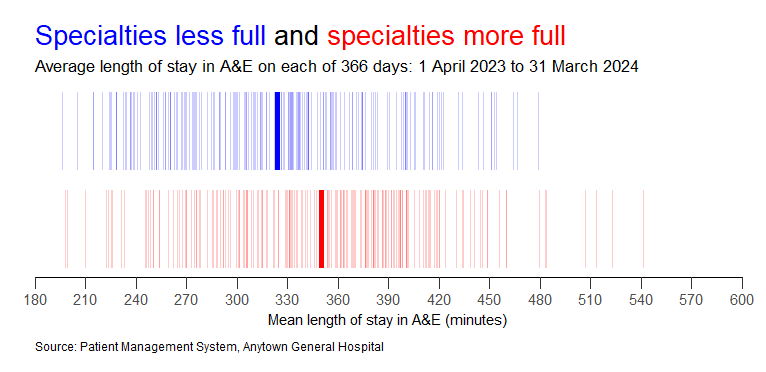
Here, for example, is the effect that medical bed fullness was having on ED length of stay in a large general hospital in 2023-24. On the blue (least full) days, ED length of stay averaged 324 minutes. On the red (most full) days, it was 350 minutes.
(In order to achieve 95% compliance, the mean length of stay in the ED probably needs to be about 150-180 minutes.)
This difference between 324 minutes and 350 minutes is a difference. 26 minutes is a statistically significant difference. But it is only a small difference.
324 minutes in the ED for the days when the medical specialty beds were least full isn't much of a result. And that's because even on the least full days, the medical beds were overflowing.
The blue days are blue because the medical specialty bed occupancy was lower than 108%. The red days are red because the bed occupancy was higher than 108%. What we're comparing here is just different degrees of extreme dysfunction!
So I've been trying out a different measure of fullness: one that's more suited for those situations when the beds are always full or overflowing. In such situations, the fullness can be better or worse depending on the length of stay of the patients generating the fullness.
I call this new measure bed 'heaviness'. We take the fullness value for each day and we multiply it by the average length of stay so far of the patients in those beds. I call it bed heaviness because it's an attempt to describe the accumulated 'weight' of a specialty's bed days.
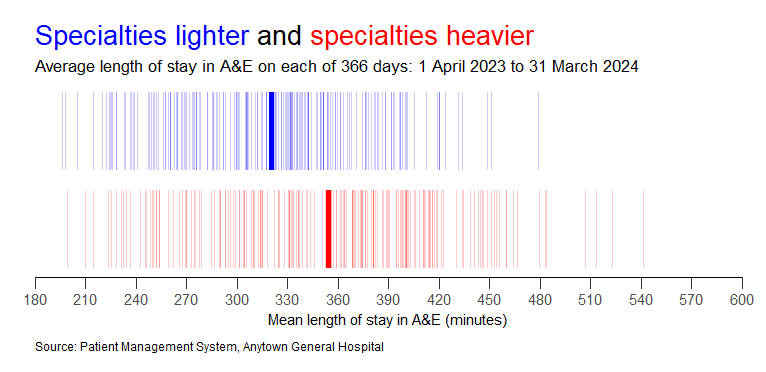
When we use this bed heaviness metric to divide the days into blue and red days, we get a bigger difference in ED length of stay: 320 minutes on the blue days. 354 minutes on the red days. The previous difference of 26 minutes has widened to 34 minutes.
But then I stood back for a moment to see what it was that I was trying to do with my bed heaviness metric. What I'm trying to do is use past bed days as a proxy for future bed days.
It's as if we're making a judgement that a ward that's 30 beds full with an average length of stay so far of 14 days is probably less likely to create an empty bed in the next few hours than a 30-beds-full ward where the average length of stay is only seven days.
But we can use retrospective data to test whether this is a reasonable judgement to make. If we know exactly how much length of stay there was remaining in these snapshots—the length of stay 'still to come'—we could calculate not just heaviness, but also future-heaviness.
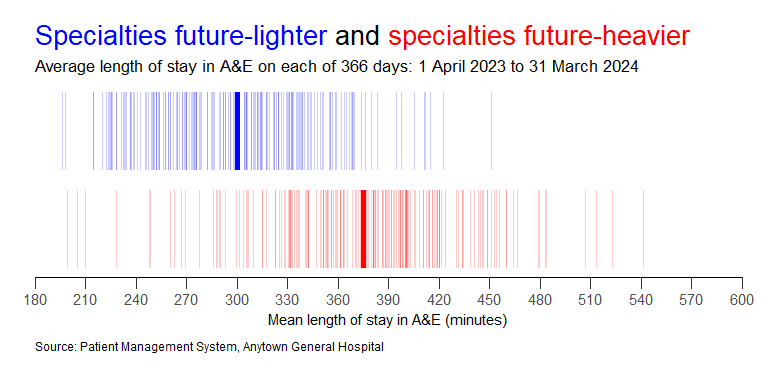
And when we do this, we get an even bigger difference. On the blue days (the 'future-light' days), ED length of stay was 300 minutes, Whereas on the red days (the 'future-heavy' days), the ED length of stay was 375 minutes. A difference of 75 minutes. Even when we are comparing two states of dysfunction.
So, to recap, if we want to get a better idea of how exit block works in a hospital that's already full or overflowing, we shouldn't just look at how full the beds are; we should 'refine' that bed fullness to take account of the likely number of bed days still to be generated in that hospital.
The future-heaviness of hospital beds. If you think 'future-heaviness' is a weird concept, have you ever looked up at a dark raincloud and wondered how much rain that cloud is 'holding', and how long and how heavy the downpour will be when it inevitably comes?
Flow_ology can be booked as an on-site face-to-face course for £1,250+VAT, and up to 12 participants can be accommodated in each workshop session. Email info@kurtosis.co.uk to start making arrangements. Open course places cost £350+VAT.