
(A page about Neil Pettinger.)
Like most data analysts, I am fascinated by the technical aspects—SQL, R, statistical inference—of data analysis. But unlike most data analysts I am more fascinated by the non-technical aspects. Two questions in particular preoccupy me: How can we acquire domain knowledge so that our data better describes decision-makers' reality? And how can we communicate the results of our analysis to decision-makers most effectively?
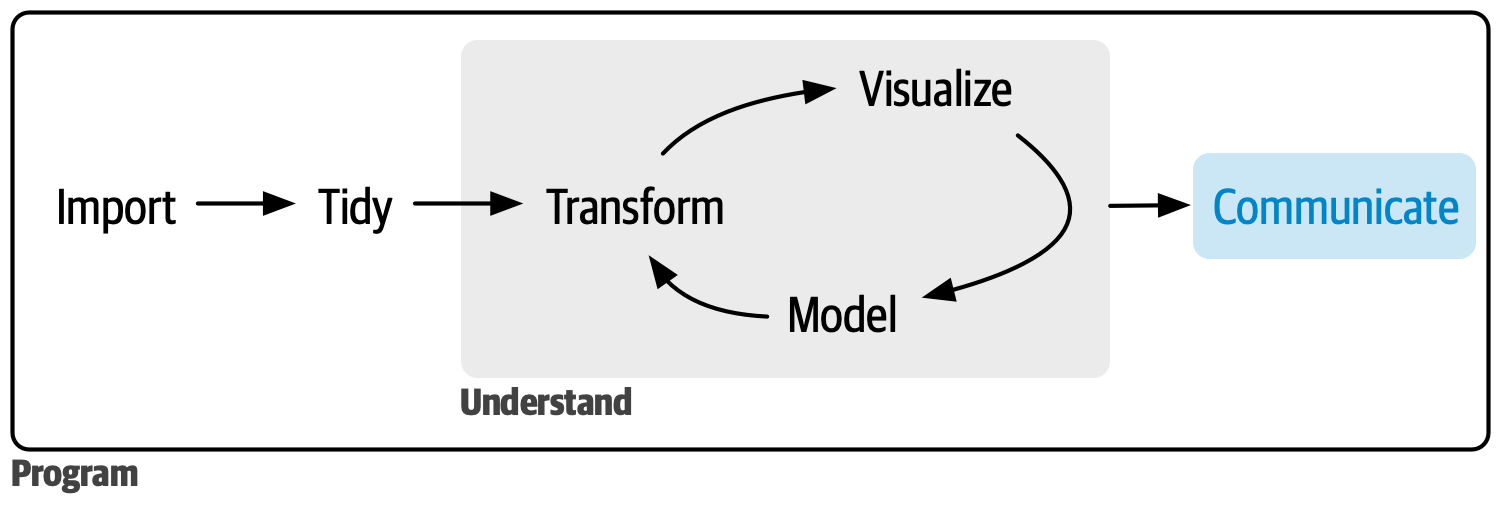
On the first page of the book R for Data Science, there's a diagram that shows how everything supposedly fits together:

The central message of this book is that if you want to do most of the stuff in this diagram, R is the tool you need. Even the more nebulous "Communicate" verb (which is highlighted in blue in the first edition, but not the second) can be addressed with tools such as R Markdown or Quarto.
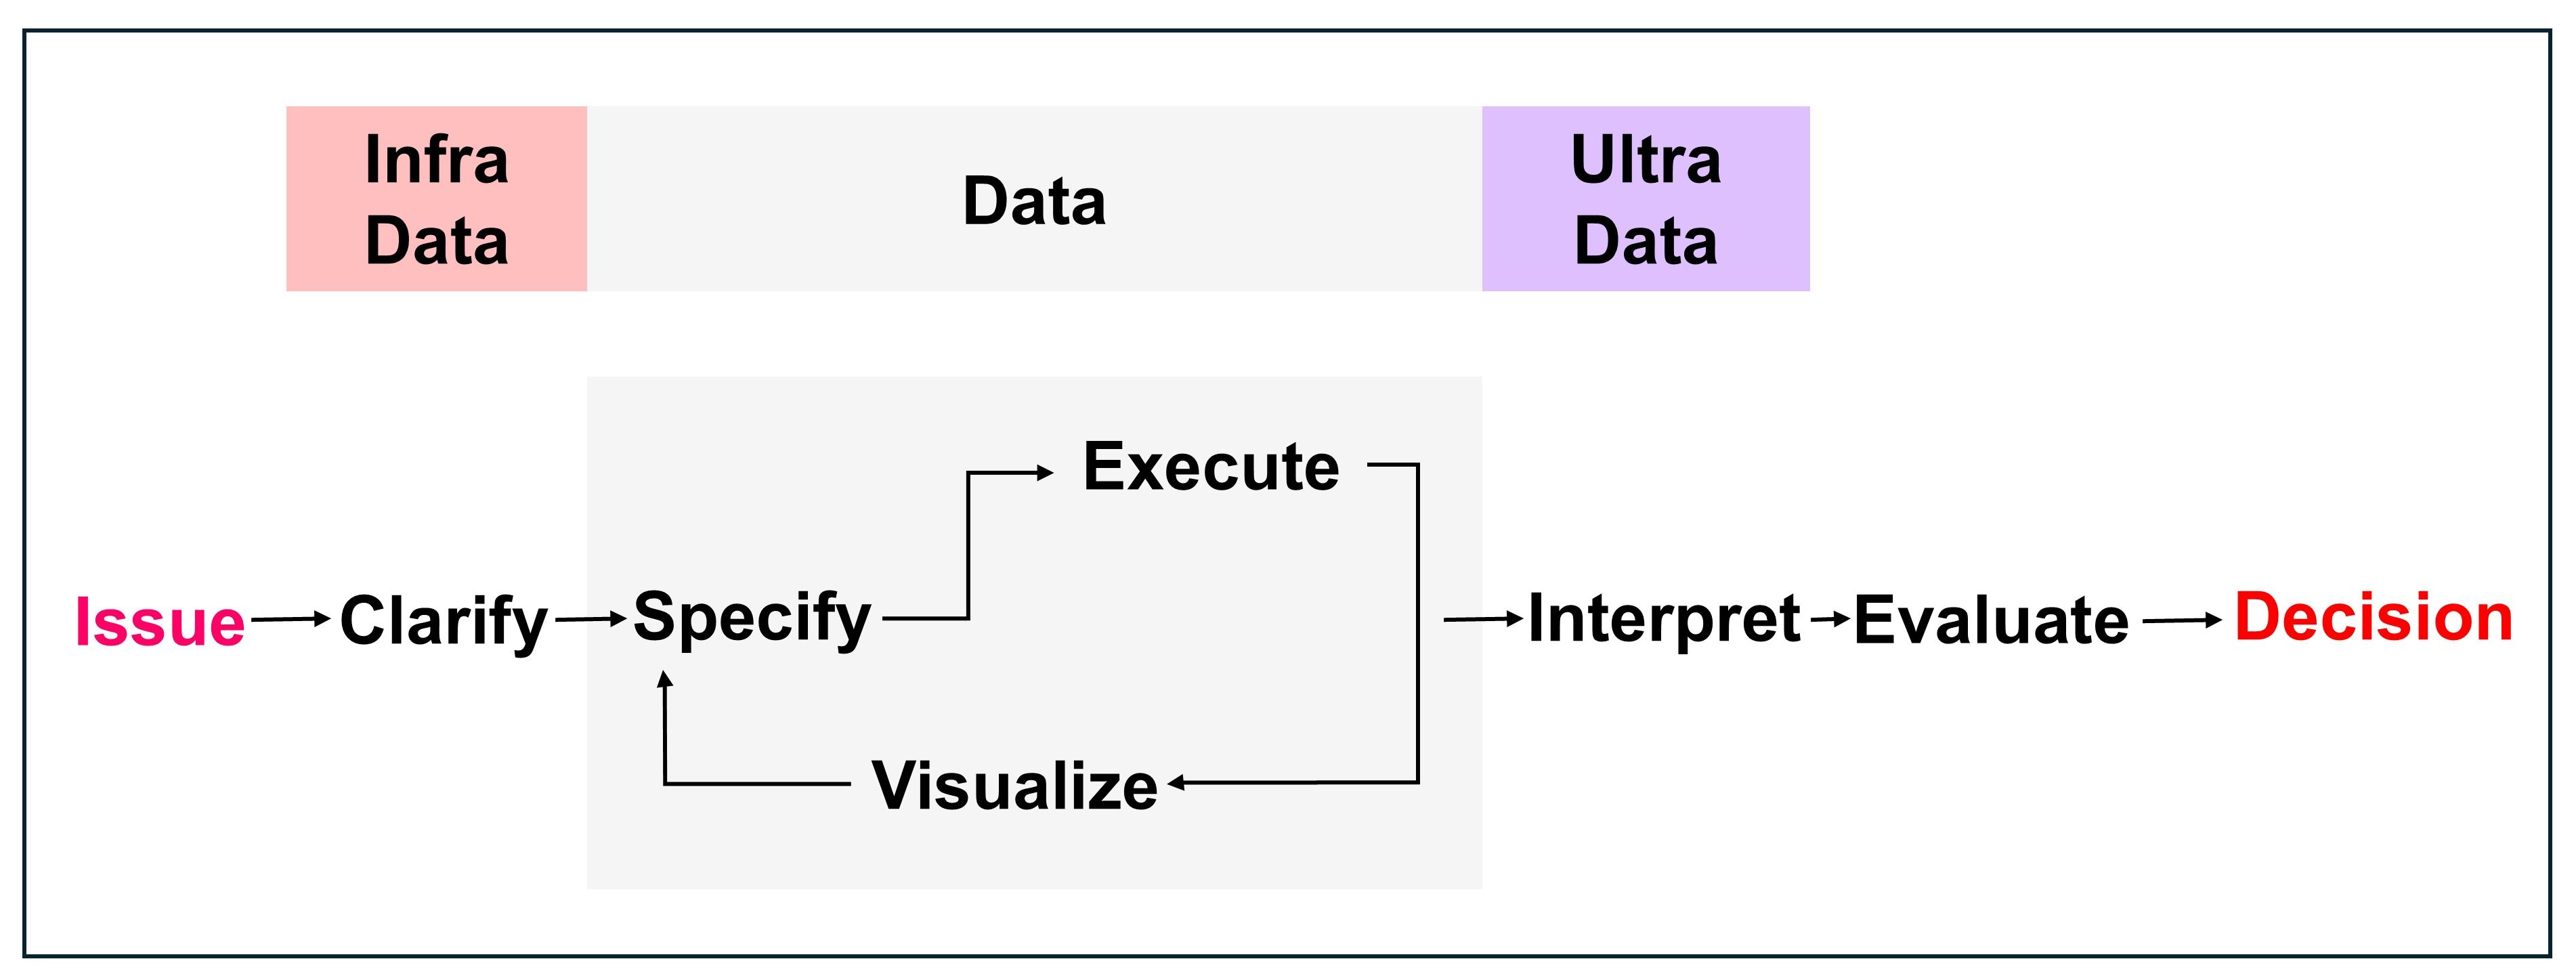
But I think this diagram is a very "tech-centric view" of how everything fits together. And it's not how I see the world. The way I see the world is more like this (and I'm copying the style of the previous diagram to try and make the differences more apparent):

This diagram begins and ends with the people we serve: the decision-makers. Decision-makers start—on the left—with an issue. It's best to think of an issue as a problem to which they want to find a solution. If data is to have a role in helping them arrive at a solution, then the first thing that needs to happen is that the decision-maker and the number-cruncher need to get together and discuss the issue in such a way that the number-cruncher can convert the issue into a data query. This Clarify step is what I sometimes call 'fieldwork': it's the work the analyst has to do in order to enhance their domain knowledge so that they can see exactly what data needs to be analysed—and how it needs to be analysed—in order to move towards a decision.
All of that Clarify stuff is what I call 'InfraData'. InfraData is the stuff you need to do before you start number-crunching. (Strictly speaking the infra prefix in Latin means "under". And the ultra prefix, which we'll get to in a minute, means "beyond". But in the context of my diagram, it might be better to think of infra- meaning "pre-" and ultra- meaning "post-". I'm sorry, but the infra- and ultra- prefixes just sound way cooler than pre- and post-!)
The three verbs in the grey box in the middle (Specify, Execute and Visualize) comprise what I often refer to as the data analyst "comfort zone". These three verbs also cover what you might call the tidyverse zone: Specify with {dplyr}, Execute with Ctrl-Enter, then Visualize with {ggplot2}. I mean, yes, this is a gross over-simplification but you get the idea.
The next two verbs is where it gets interesting again. The Interpret verb is meant in the context of a language interpreter. The number-crunchers have to be able to find the right words to describe the numbers. After all, to most decision-makers, numbers are like a foreign language to them, so they expect number-crunchers to act as translators.
In my worldview, the Interpret verb (ultra-data) is best acted out using the spoken word. In meetings. This is because in my 39 years' experience of working in healthcare in the UK, meetings are where decision are made. And if that's where decisions are made, then that's where number-crunchers also need to be.
In my diagram, the 'act' of decision-making is called Evaluate, and it's actually not somethng that's the responsibility of the data analyst; instead, it's the responsibility of the decision-maker. But the more the data analyst understands about how the evaluate process works, the better equipped they will be to analyse, visualize, present and interpret the right data in the most effective manner.
So that's me. My 'credo'. Yes, the analysis and visualization aspects of number-crunching are important. But not nearly as important as the infra-data (fieldwork) or ultra-data (presenting and discussing data in meetings) aspects.