I stumbled across some of Barbara Probst's photographs just over a year ago. They were photographs from a fashion shoot, and the pictures had all been taken on the same street corner in New York City, but Probst had used mutiple cameras, each camera positioned in a different location with a different lens, a different aperture setting, a different shutter speed setting and so on, but they were all connected together so that she could take several photographs of the fashion models simultaneously. What you got at the end of all that process was the same 'moment' but because it was being seen from several different angles, each of those moments looked completely different. And it was the point of view that made all the difference*.
Barbara Probst's work has prompted at least three separate trains of thought, all of which have kept me awake at various points in the last 15 months. What I've been trying to do is take this fascinating photographic technique and see how it might be applied to data analysis and presentation.
One train of thought is to take the technique literally, and to think a bit more deeply—a bit more self-consciously—about how we might adopt different viewpoints when we analyse data. Our jobs will play a big part in defining our viewpoint. Are we looking at the data from the perspective of the acute hospital? Or from the perspective of a GP practice? Or from the patient's point of view? Or the taxpayer's point of view?
A second point of departure is the idea that we often don't even consider the possibility of different viewpoints when we analyse and present data; we just give people one viewpoint. And it occurred to me that this 'one version of the truth' approach contrasts with the way architects—for example—present their work. (My 'office' in Edinburgh is basically a desk that I rent from a firm of architects, so on the rare occasions when I am actually in my office, I am surrounded by their drawings and photographs and models.) It is striking that they routinely produce different versions of the same thing for their clients. Front elevation. Side elevation. Site plan. Cross section. Different viewpoints abound.
A third train of thought is specfically about patient flow. In my search for ways of describing and understanding patient flow, I've experimented with a whole range of ways of analysing and presenting data. (Flowopoly. Flow_ology. I want Flowtopia™ to be next!) For a long time, I think I've been trying to use data to create a version of patient flow 'reality' that enables people from different viewpoints (nurses, AHPs, doctors, service managers, bed managers, social workers, accountants...) to share the same mental model. I have been wedded to this 'same mental model' idea ever since I came across it in a book by Chris Ertel and Lisa Kay Solomon called Moments of Impact that I read in the Spring of 2013.
I had always assumed that it would somehow be possible to find one single way of presenting the data that encompassed all of the various viewpoints. I supposed that the solution would be some kind of 'metaview'.
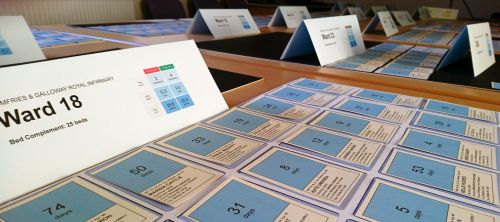
But I am now leaning towards a different conclusion. I'm no longer sure we should be striving for 'th the e one true view of reality'. I'm now towards the idea that we should be showing a multiplicity of views. And the way we now do the REPLAY session in Flow_ology is a good example of how I'm trying to do that. At one level, the viewpoint is the view of the indivual day (the 'bad' day first, then the 'good' day), so what is included in the view is all the patients who happened to arrive or depart or who just happened to be occupying beds in the hospital during that day.
On another level, it is difficult not to take the patient's viewpoint. There are cards littered all over the tabletops during a Flow_ology replay, with (made-up) names and ages on each card. So yes, here is the viewpoint of the patient, lots of patients—hundreds of them—and if you look underneath each patient's 'current' card you can see each patient's 'flow history' underneath, with each card representing a different ward move that took place prior to the current one.
And then, once we've replayed all of the individual patient moves one each day, we then 'zoom in' (another viewpoint) to just one part of the system (usually the Care of the Elderly wards), and we replay a week in the life of that part of the system. So: a different lens, a different shutter speed.
And after that, we zoom out and try to summarise all of this individual patient detail and granularity into aggregated, summarised data.
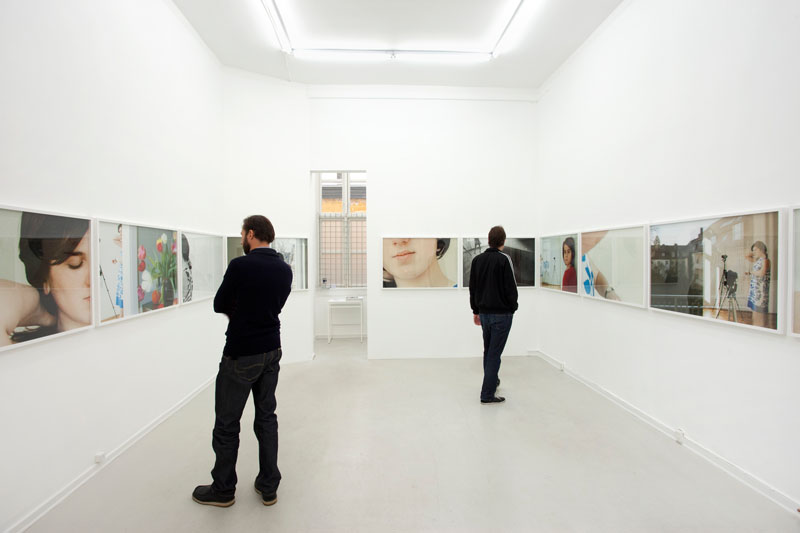
But it's the multiplicity of camera angles that creates the sense of the big picture. I'm now much more in favour of the idea that we should be looking at data in the same way we might view Barbara Probst's photographs in a gallery space. Lots of different versions of the same reality, all adding up to a mental model of the 'bigger' picture.
*...and if you are intrigued by the work of Barbara Probst, please have a look at this five-minute video in which she explains her approach in more detail.
[11 October 2019]