If—like me—you're an adherent of the Exit Block Theory of A&E Performance, then you believe that the fullness of the destination—the admissions wards, in particular the Acute Medical Unit (AMU)—affects how long people spend in the Emergency Department (ED) before they get admitted. In a typical general hospital, roughly 30% of ED attendances end up being admitted, and—in general—the fuller the admissions wards, the longer the admissions-ward-bound patients in the ED have to wait before a bed becomes available.
Moreover, exit block also affects the ED length of stay of patients who don't get admitted, because the care of the non-admitted patients gets compromised by the necessity of stretched ED staff having to look after the waiting-to-be-admitted patients while they're waiting for a bed.
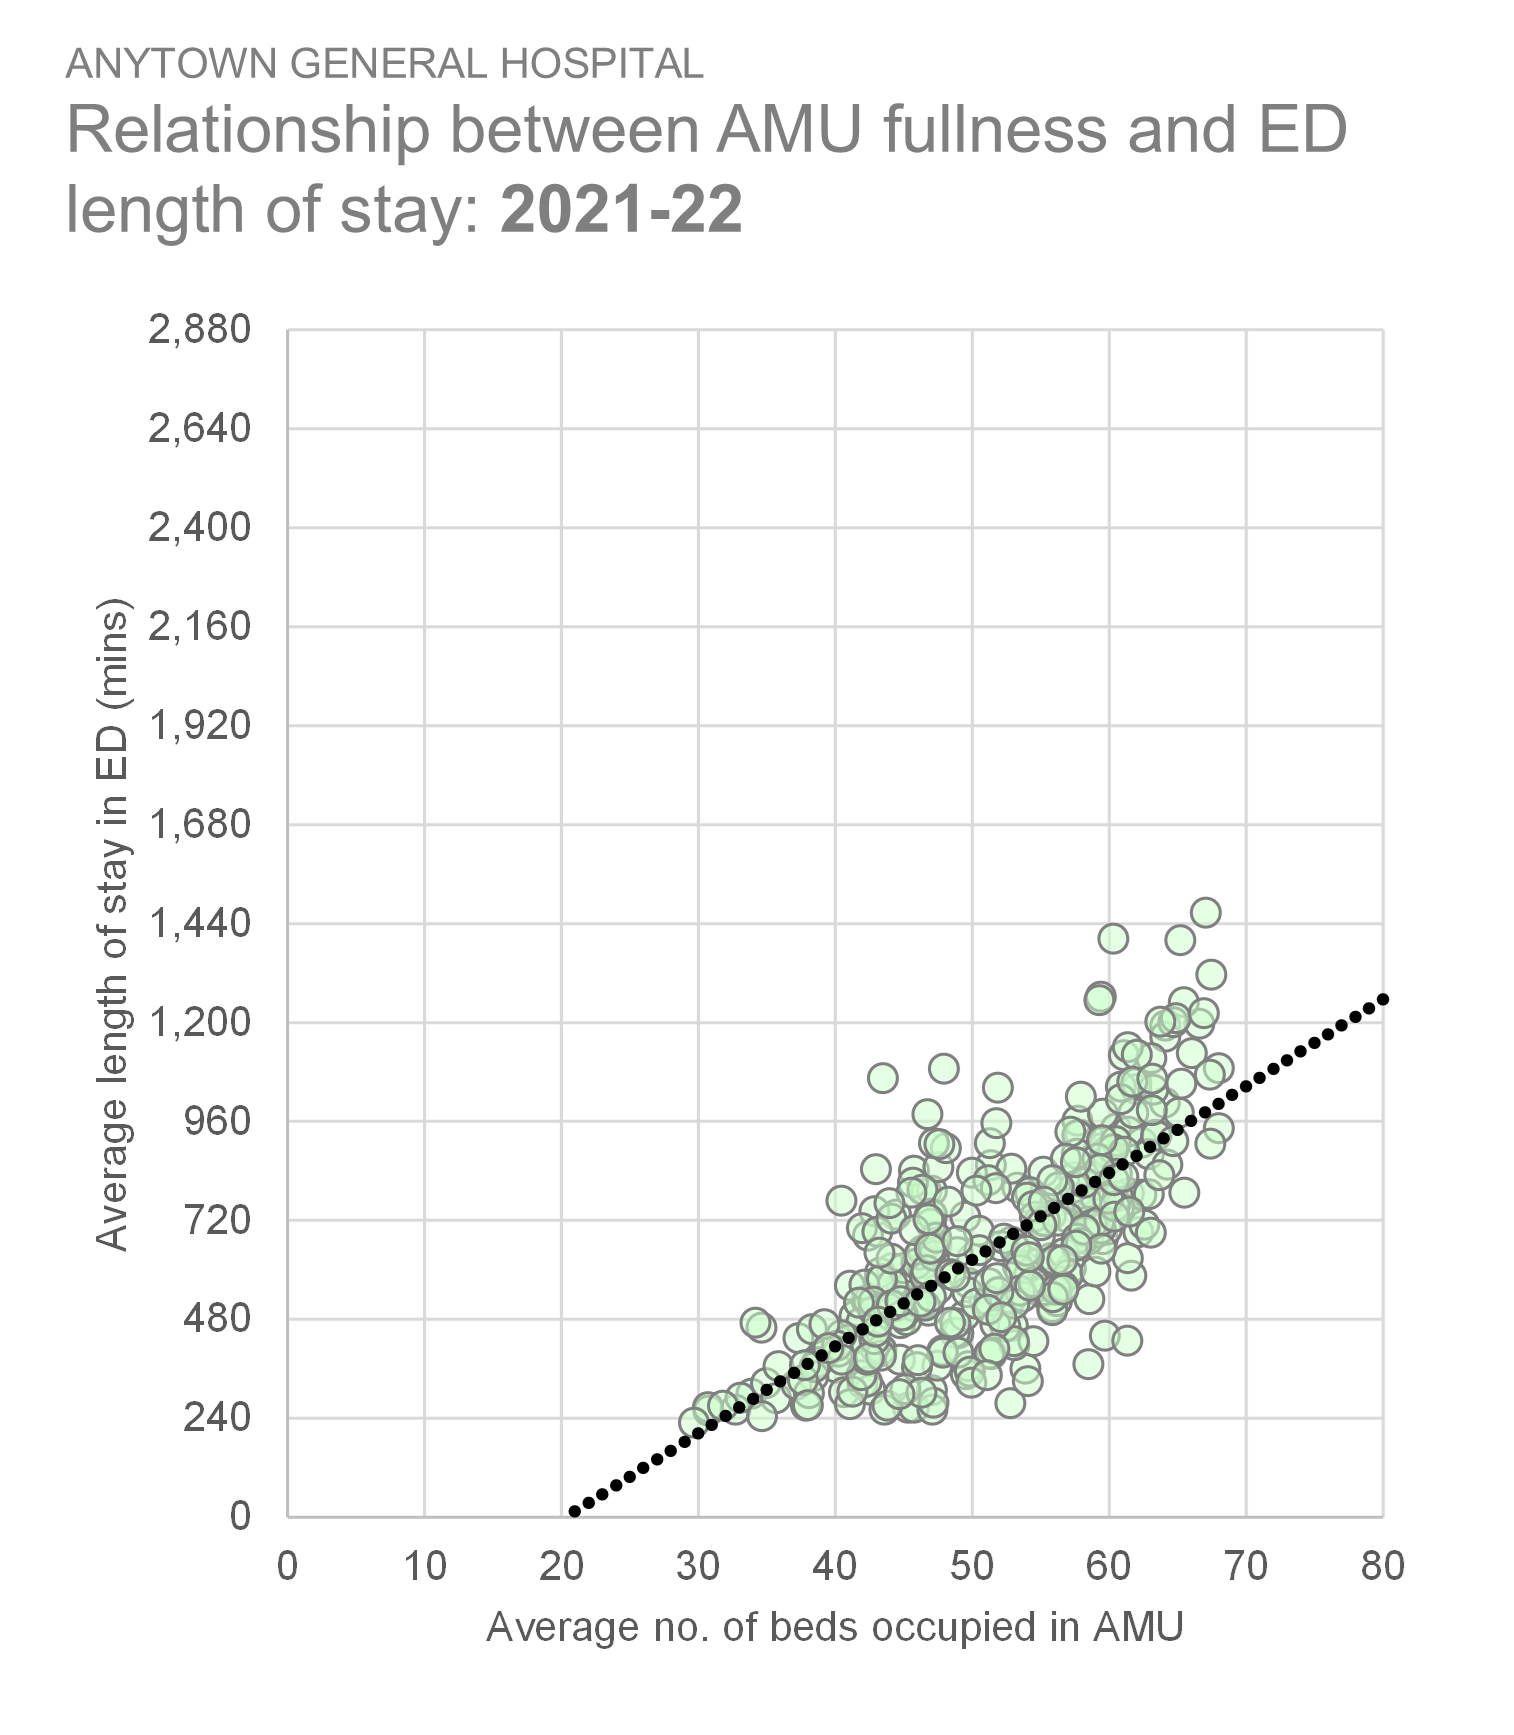
It's worth noting that Exit Block isn't some top-down, academic, data-derived theory; it's a bottom-up reality (observed and endured by countless NHS staff every hour of every day) that just happens to be confirmed by the data. And this theory has always held whenever I've looked at the data, in a whole host of different hospitals across the UK. From back when I started testing this hypothesis (as long ago as 2015-16, but even as late as 2021-22, I was getting reasonably high levels of correlation for the relationship between admission ward bed occupancy and ED length of stay. Here, for example is a large acute hospital as recently as 2021-22:
The diagonal trendline makes the point about this graph. There are 365 dots here, each one representing a day. And the fuller the AMU (measured along the horizontal axis), the longer the length of stay of AMU-bound patients (measured up the vertical axis in minutes). The r-value (the coefficient of correlation) is 0.72.
But when we look at data for a more recent time period, this relationship between AMU fullness and ED length of stay for AMU-bound patients appears to have disappeared. Here—below—is the same hospital just two years later, in 2023-24. Same metrics, same methods, but now only an r-value of 0.24. An r so low that I've tried to 'grey-out' the (fairly meaningless) trendline!
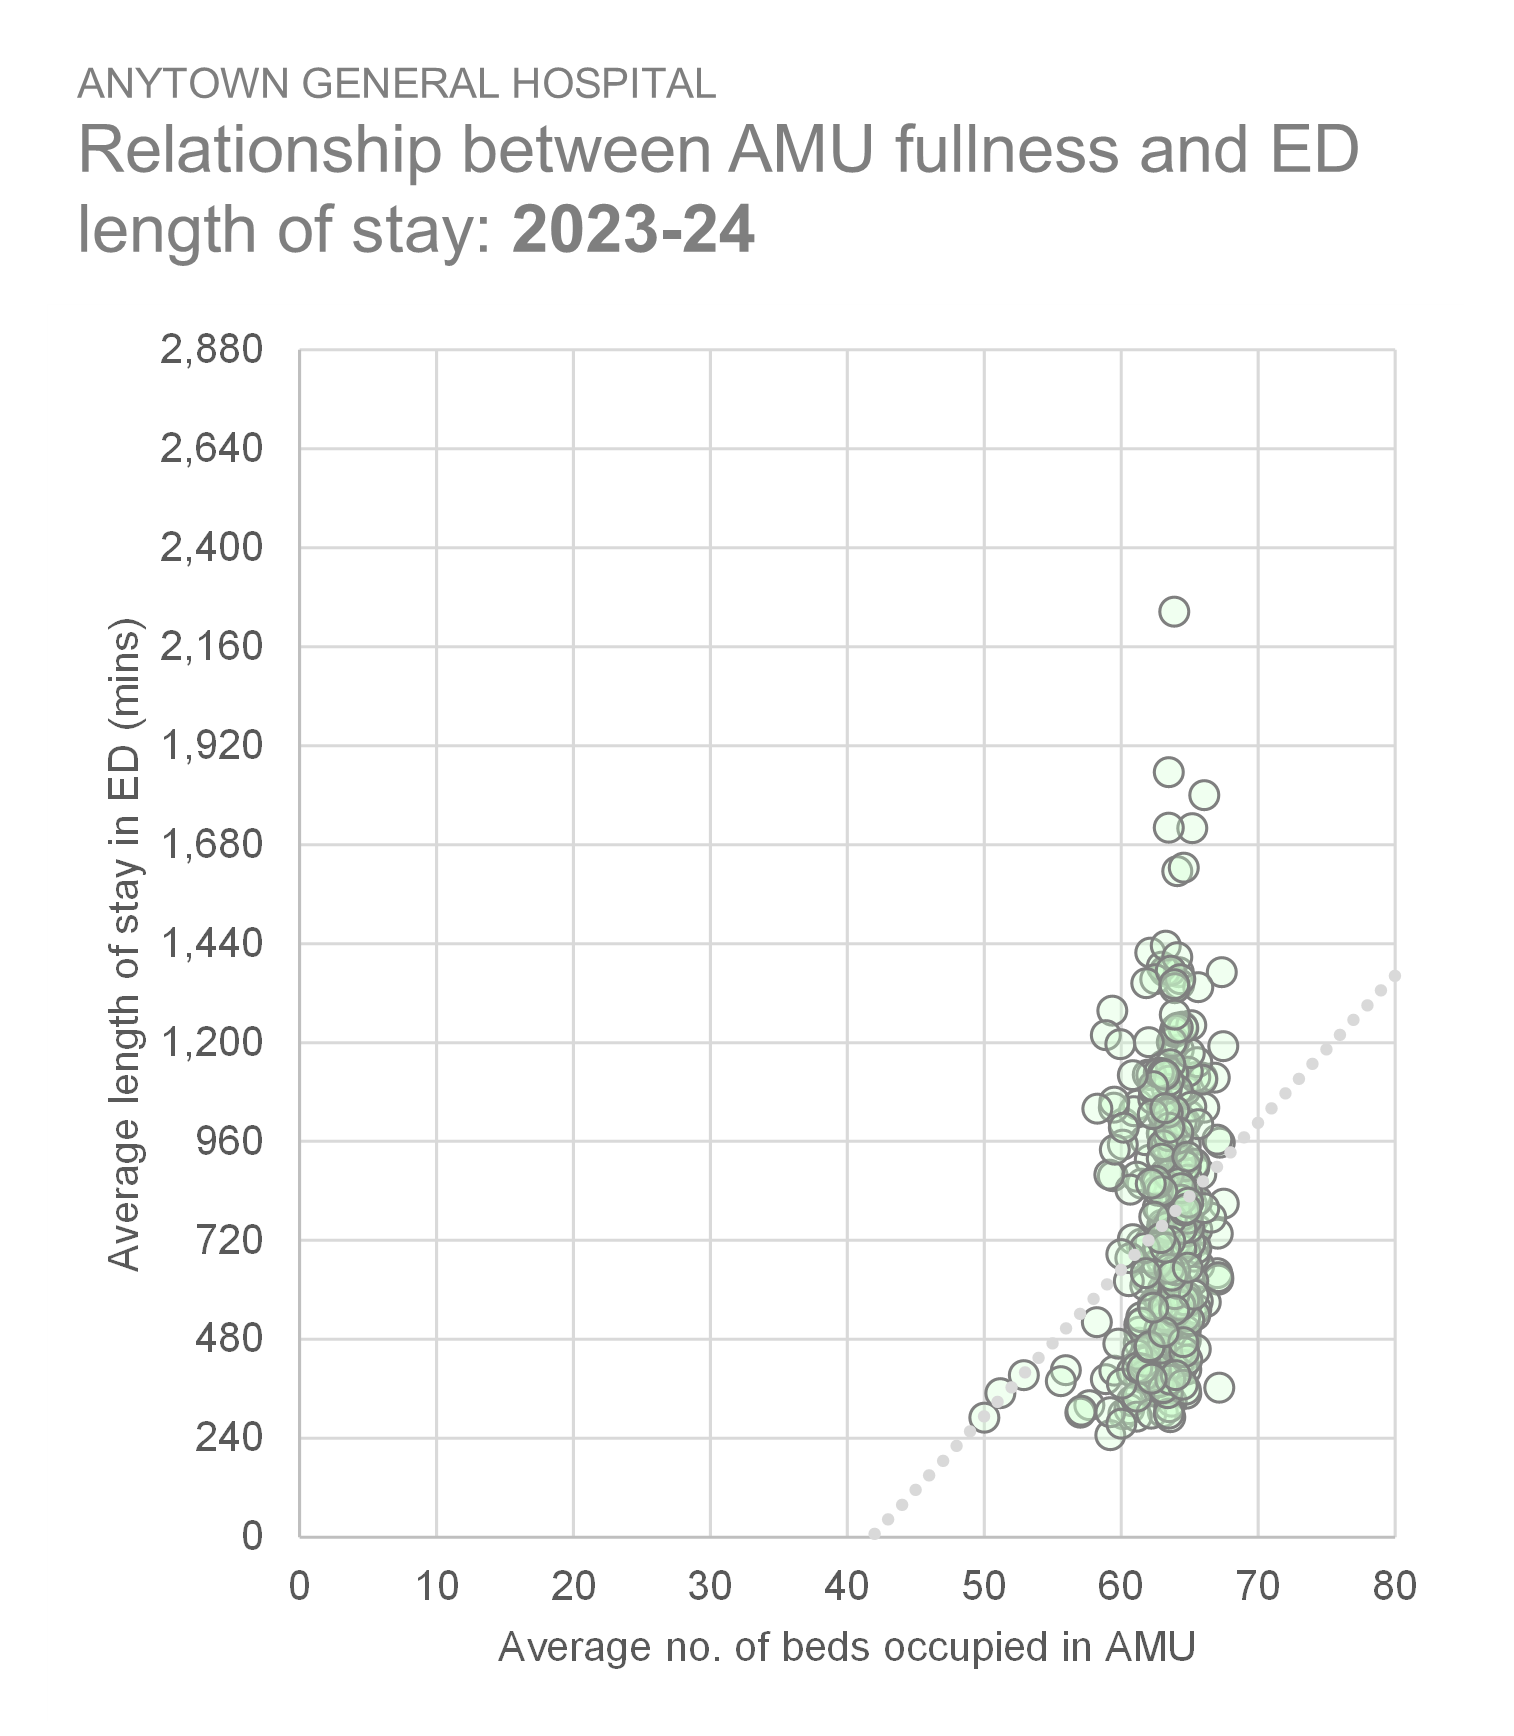
I think we can see what's going on here. The AMU fullness values in the second graph are much more concentrated, much more compressed than in the first graph. There was hardly a day in 2023-24 when the AMU had fewer than 60 beds occupied, and it never had more than 68, which was the bed allocation ceiling for this AMU. In 2021-22, by contrast, there was much more day-to-day variation in AMU bed occupancy, including one or two days when it was less than 50% full.
The upshot of this is that—according to the second graph—we get long waits in the ED regardless of the level of AMU fullness. It looks as if the Exit Block Theory takes a bit of a battering when the AMU is pretty much always full.
Or does it?
Maybe the fullness of the beds isn't the only way of measuring and describing exit block. Maybe there's another measure we can use.
At this point, I remembered a series of conversations I'd had with a group of clinicians last year, in which they drew my attention to the difference between what they called 'active' beds and 'inactive' beds. Essentially, an active bed is one that is occupied, but it's only been occupied for a relatively short period of time. Whereas an inactive bed is a bed that's already been occupied for ages. It's almost as if we can discount inactive beds for bed management purposes because the chances of achieving discharges from them today, tomorrow or the day after are so slim as to be virtually non-existent.
This active/inactive bed 'theory' was explained to me in the context of downstream inpatient specialty beds, but I wondered if the same theory might also be capable of explaining how Acute Medical Unit beds worked. So I went to each daily fullness snapshot in my 2023-24 dataset and calculated what the average length of stay so far was for each patient captured in each hourly snapshot. In other words, how long had the patients already been staying in the AMU beds at the time the snapshot was taken?
I then looked to see if there was a relationship between ED length of stay and my new measure: the AMU length of stay so far.
And yes, I found that there absolutely was.
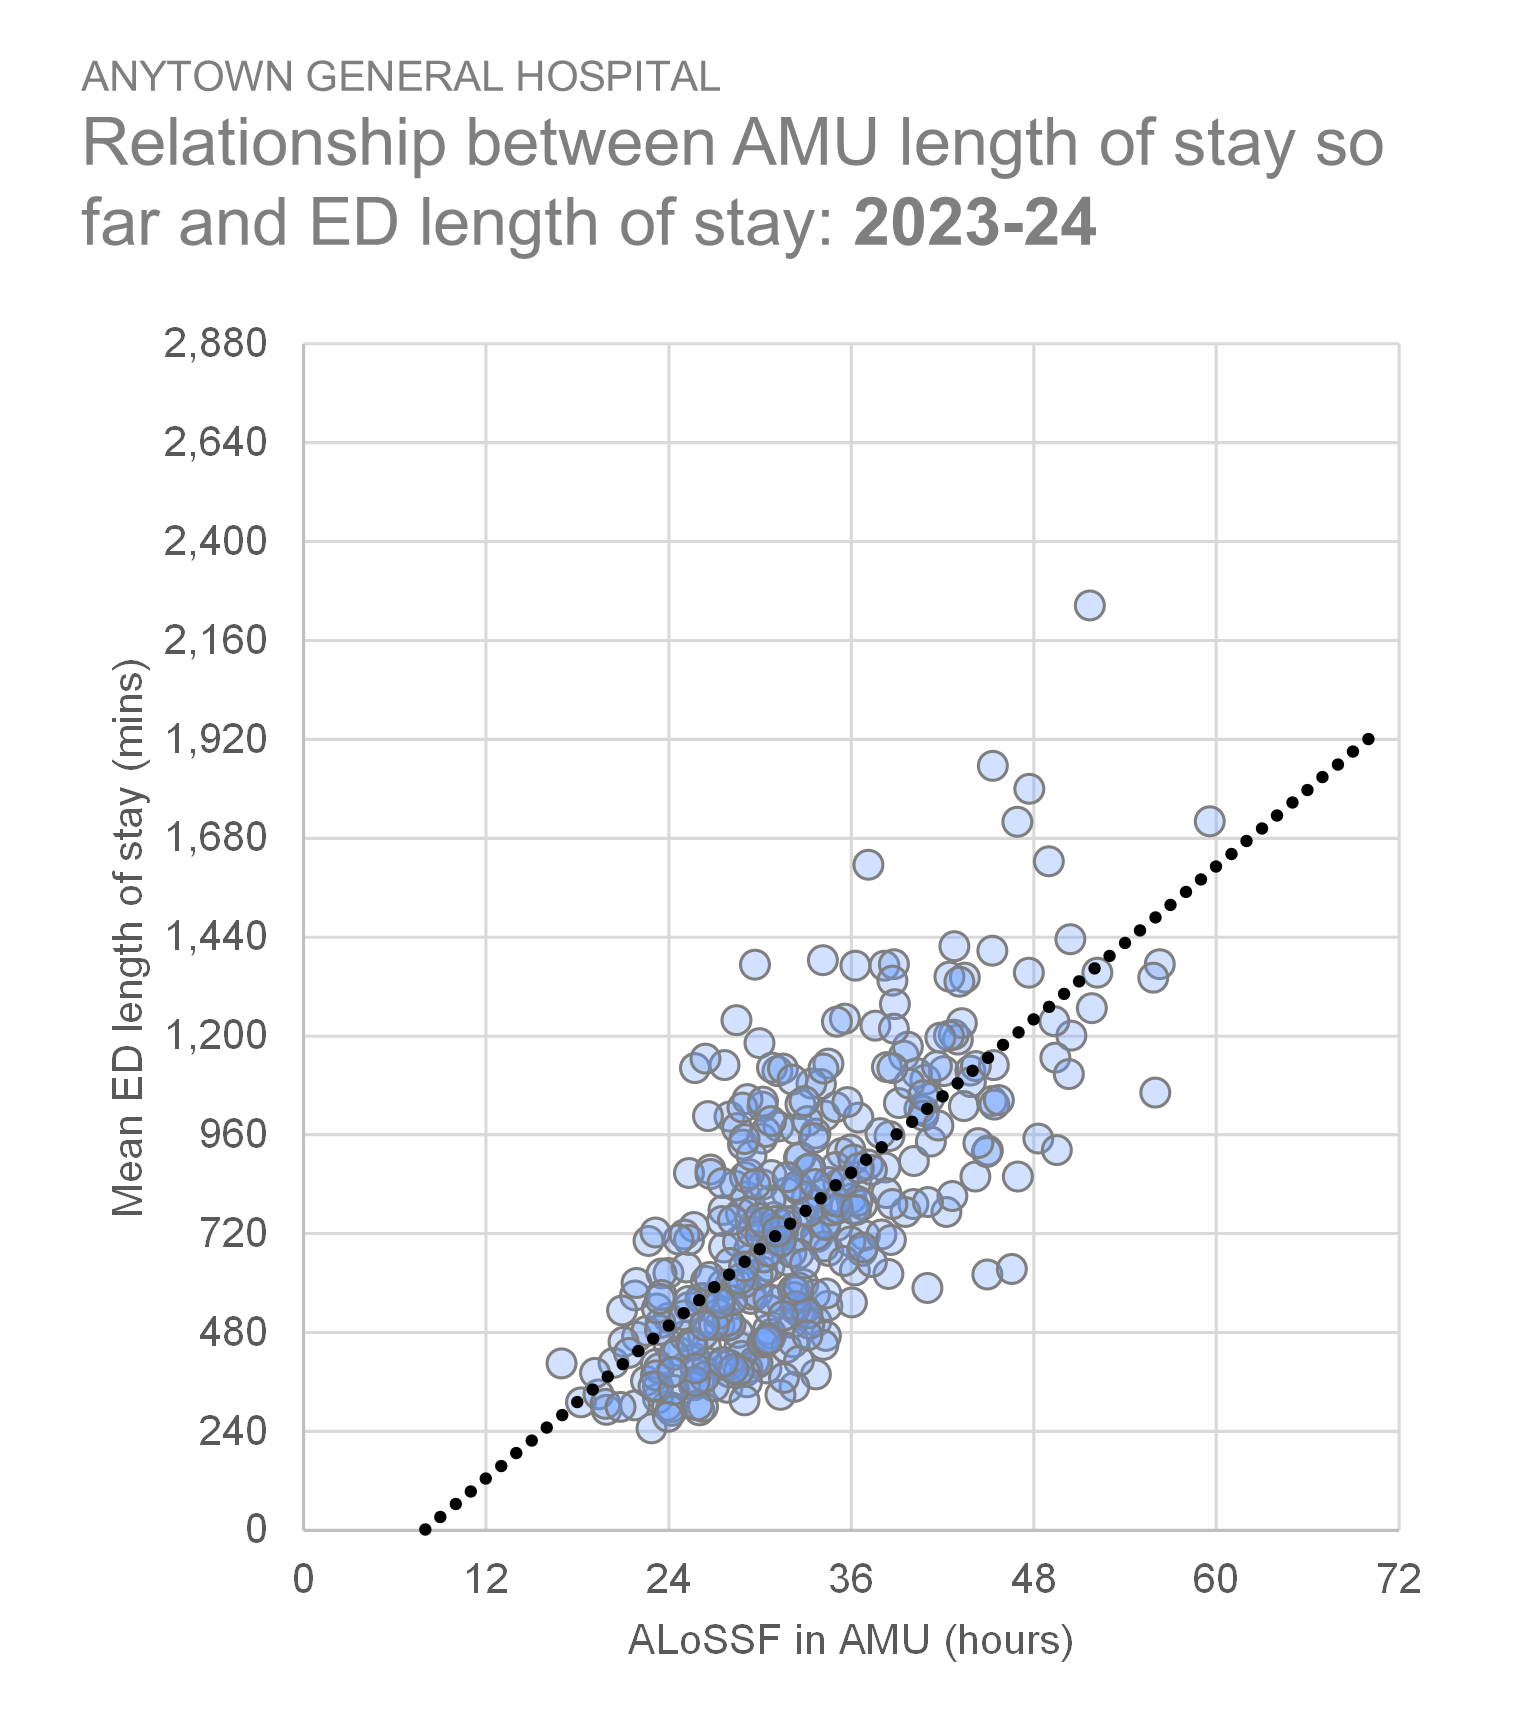
We're back to a good correlation. r = 0.74 for this relationship. The length of time AMU-bound patients spend in the ED before being admitted to the AMU is strongly related to the length of stay of the patients in AMU at the time the ED patient needs to be admitted.
So the Exit Block Theory of A&E Performance lives on; it's just that we've had to tweak it a bit: the AMU average length of stay so far could well be my new favourite indicator!
[21 February 2025]