Open workshop date: Fri 11th November 2022
Time: 9:30am to 4:30pm
Venue: Wallacespace, 18 Clerkenwell Green, London EC1R 0DP
Price: £250+VAT per place
Contact: email info@kurtosis.co.uk to reserve a place
Patient flow continues to be a problem.
Everyone know that data must have a role in the solving of the patient flow problem. We even use data to describe the problem. For example, the percentage compliance with the four-hour target, the number of beds occupied in the 'wrong' wards by outliers, the number of delayed transfers of care. We also know that most decision-makers are using data every day to try and solve the problem of patient flow.
But the data isn't working.
FlowStories proposes a totally new perspective. The two cornerstones of this new perspective are: (1) a focus on individual patient journeys and (2) an insistence that we look at all the silos simultaneously. This is data on patient flow that's analysed and presented in a completely different way. And data that's also looked at in a completely different way.

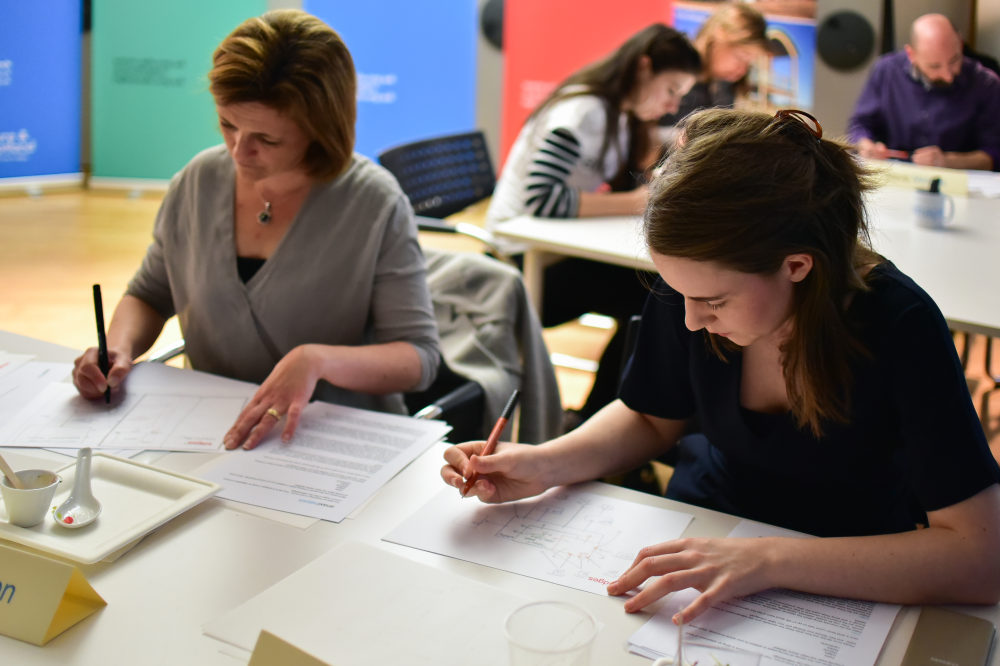
FlowStories is a full-day (9:30 to 16:30), four-session workshop. Each session lasts 90 minutes.
Session 1 starts with some individual patient journeys. Long journeys, short journeys, journeys that meet obstacles, journeys that flow smoothly. But all of the journeys share one important thing in common: they all pass through all of the silos. We use these individual patient stories to build our understand of flow from the bottom up, and to do the detective work that uncovers what the flow problems are. This takes us to exit block—or staging post fullness—as the prime suspect. So we then put fullness under the microscope. Fullness in all of the silos: downstream specialty wards, admission wards, the Emergency Department. And we find out what we need to do in order to work out the 'ought-to-be' fullness values for each of the staging posts.
Session 2 focuses on how we can then use these 'ought-to-be' fullness values to work out what the other flow metrics need to be: the numbers of attendances, admissions and transfers, the length of stay of these attendances, admissions and transfers, the number of beds available to accommodate these patients. This gets us to a point where we can identify what changes we need to make in order to make the flow improve.

Session 3 is when we model these changes using table-top Flowopoly-style techniques. It's possible that the managers and clinicians who work in the various silos of an unscheduled care system won't just automatically 'believe' the 'ought-to-be' metrics just because an analyst worked them out with a bit of black box tinkering behind the scenes. So we have to do some modelling to see if—for example—a reduction of 0.5 days in the length of stay of Stroke patients really will make the difference to bed occupancy the analyst says it will. So in the third session we get our hands dirty with some individual patient flow 'what-if' modelling.
Once we've ascertained—via the modelling—that our patient flow solution is viable, we can then turn to implementation. Session 4 is about what data we need to look at—and how we need to look at it—and there is an emphasis again on individual patient journeys through all the silos in order to monitor a change in—for example—length of stay.
FlowStories is an open workshop aimed at multi-disciplinary groups of participants. Doctors, nurses, AHPs, executive directors, service managers, improvement managers, bed managers, data analysts. The workshop is facilitated by Neil Pettinger.