Photo by Ellie Morag
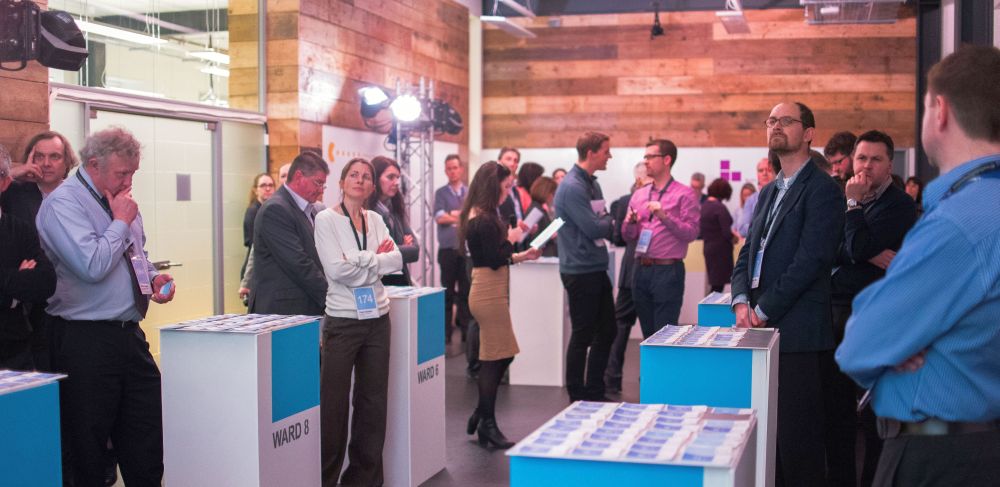
Flowopoly is a hands-on, highly participative, one-day workshop. It combines 'day-in-the-life-of-a-hospital' replays with group exercises so that participants can—firstly—get an appreciation of what patient flow looks like in all its panoramic glory, and then—secondly—work out the 'ought-to-be' numbers that will improve patient flow.
Session 1
9:30 to 10:45
What does patient flow look like?
After a brief introduction to the aims and objectives of the day, we set up the tables, boards and cards so that we can replay a typical few hours in the life of a district general hospital. We replay arrivals, transfers and departures. Once the replay is finished (after about 20 minutes), we spend time as a group reviewing and discussing what we've just seen. Then we single out a few specific 'flow moments' in order to work out exactly what happens when patients move from one staging post to another, and why those moves can be delayed.
Session 2
11:00 to 12:30
Zoom in on one specialty
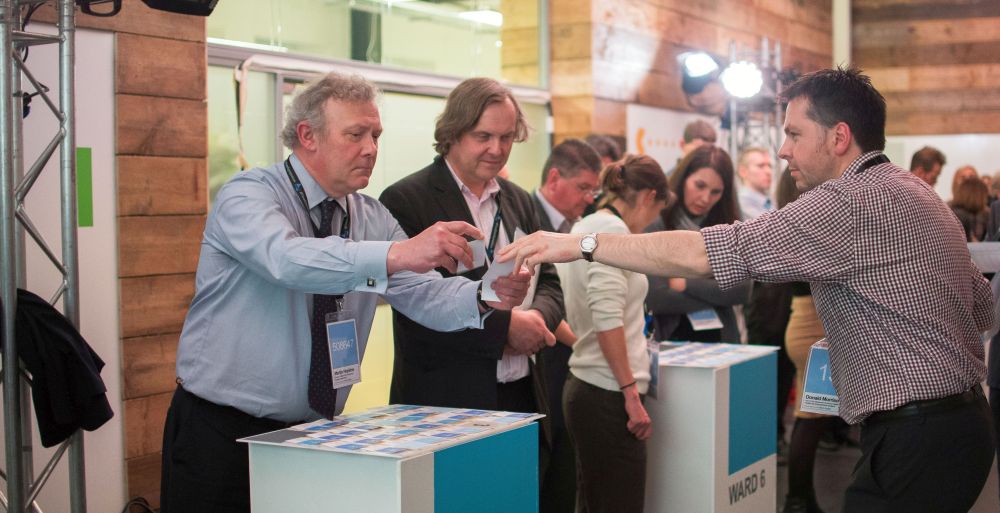
Session 2 begins with a longer, more in-depth replay. We focus on one specific downstream specialty and replay a fortnight of its arrivals, departures and transfers. Importantly, we don't just look at the movements in and out of the specialty; we also make visible all of the prior flow movements (for example, in and out of the Emergency Department, then in and out of the Acute Medical Unit). This in-depth focus on one particular pathway through the staging posts allows us to dig into the underlying cause-and-effect dynamics of patient flow, and we spend time developing a knowledge of how the three metrics of activity, length of stay and bed occupancy interact and inter-relate.
Session 3
13:30 to 14:45
What if we made things better?
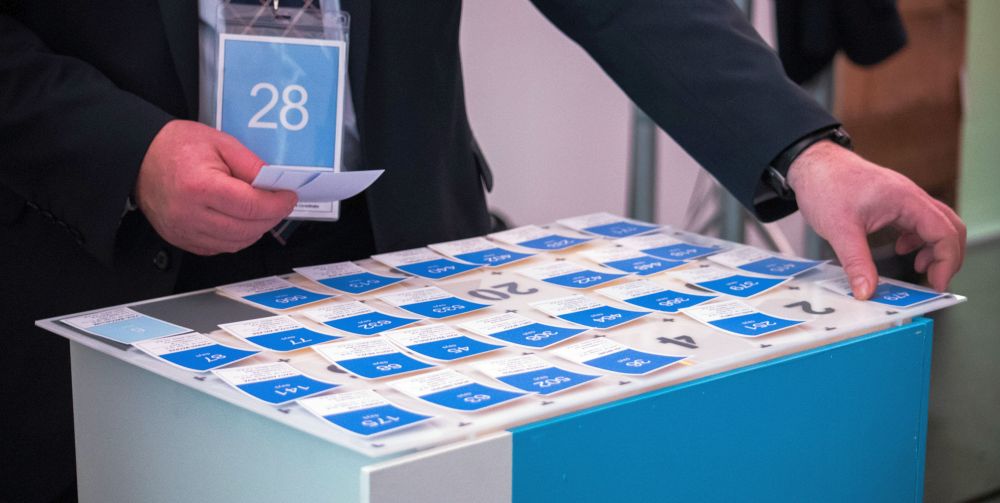
In the third session we harness our knowedge of the three key flow metrics to work out a set of 'ought-to-be' numbers that we then apply to the specialty. We then run a second replay, with the same (anonymous) patients, in the same wards, in the same time period, but with modelled dates and times. We are able to see the impact of changes in length of stay on the bed occupancy and the prior patient flow.
Session 4
15:00 to 16:00
How can we use data to enable and monitor changes to patient flow?
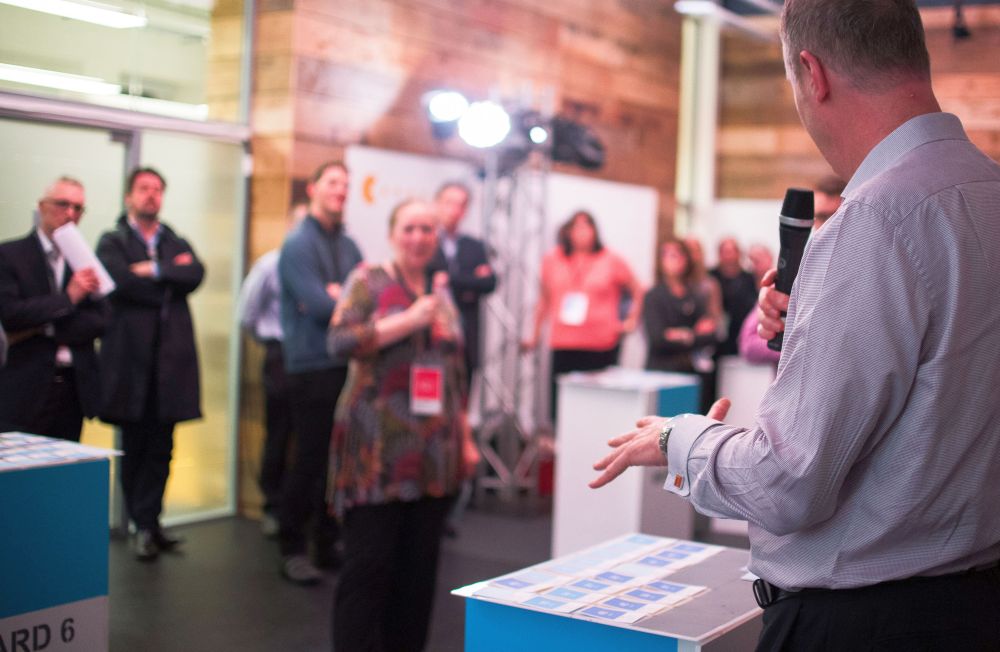
In the final hour of the workshop, we examine how 'ought-to-be' flow metrics (for example, if your average inflow is 4.5 patients per day, and your average fullness needs to be 74.2 patients, your average length of stay needs to be 16.5 days) can be introduced, embedded and monitored on an ongoing basis in real life hospital settings.
Flowopoly can be booked as an on-site workshop for £1,250+VAT, and up to 36 participants can be accommodated in a session facilitated by Neil Pettinger. Email info@kurtosis.co.uk to start making arrangements.